
Fig. 8.
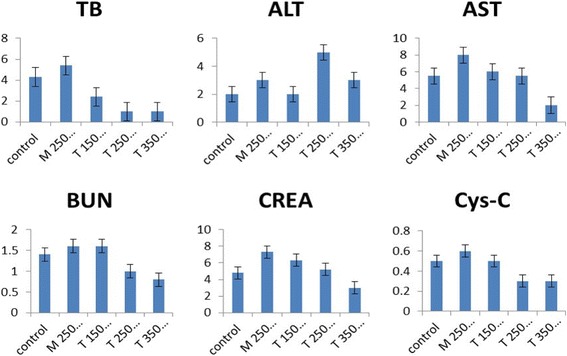
Biochemical indexes content in serum after different dosages (in μg) of PEG-CoFe2O4 exposure to mice with error bars shown in the figure
Official websites use .gov
A
.gov website belongs to an official
government organization in the United States.
Secure .gov websites use HTTPS
A lock (
) or https:// means you've safely
connected to the .gov website. Share sensitive
information only on official, secure websites.
Biochemical indexes content in serum after different dosages (in μg) of PEG-CoFe2O4 exposure to mice with error bars shown in the figure