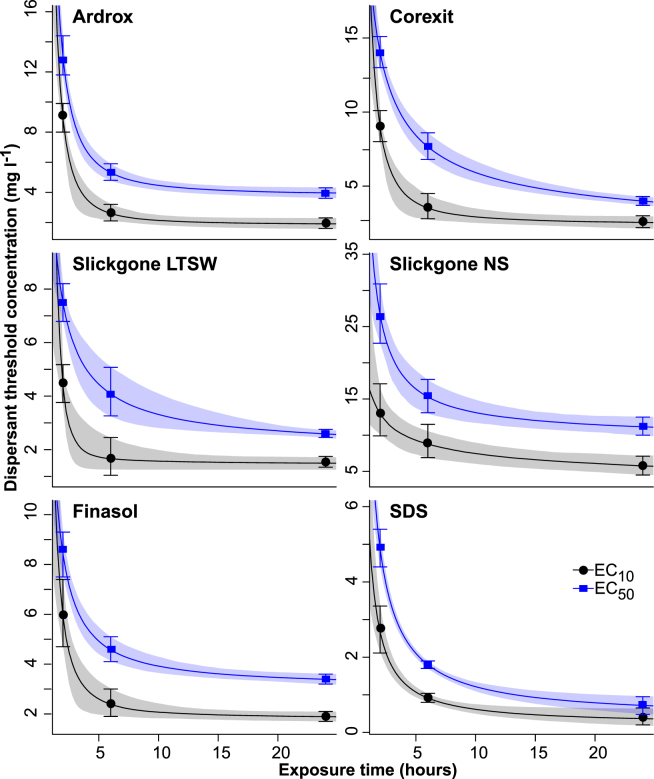
Figure 3.
Time dependence of estimated EC10 and EC50 concentrations for each dispersant, with values and 95% confidence bars taken from Table 4. Solids lines are fitted three parameter exponential decay relationships, with shaded areas representing 95% confidence bands based on 1000 iterations of a monte-carlo simulation sampling from gamma distributions fitted to the estimated threshold concentration values and their 95% confidence bands.

