Figure 8.

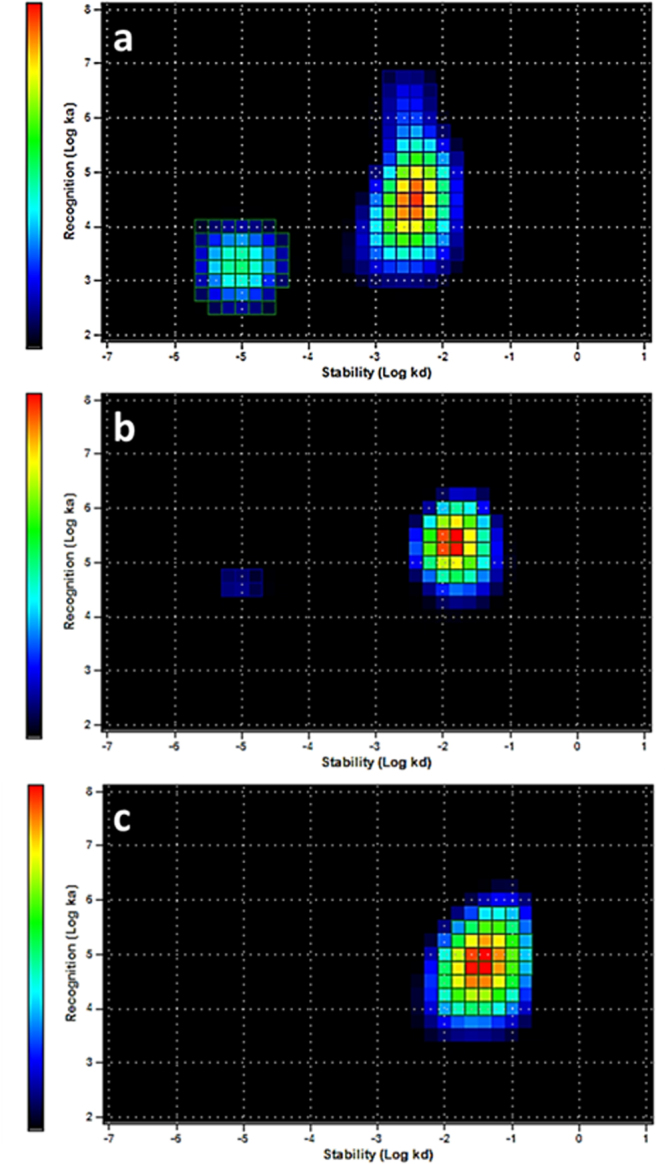
InteractionMaps of 111In-DTPA-A9 interaction with HER2-expressing BT474 cells (a). Concentrations of 111In-DTPA-A9 were 4, 12 and 36 nM. Fitting binding LigandTracer curves to 1:2 interaction models suggest presence of two interactions, one stronger (4.9 nM) and one weaker but predominant (103 nM); (b) 111In-DTPA-A9 interaction with HER2-expressing BT474 cells in the presence of large excess of trastuzumab. Concentrations of 111In-DTPA-A9 and timing were the same as above; (c) 111In-DTPA-S-A9 interaction with HER2-expressing BT474 cells. Concentrations of 111In-DTPA-S-A9 (4, 12 and 36 nM) and timing were the same as for 111In-DTPA-A9.
