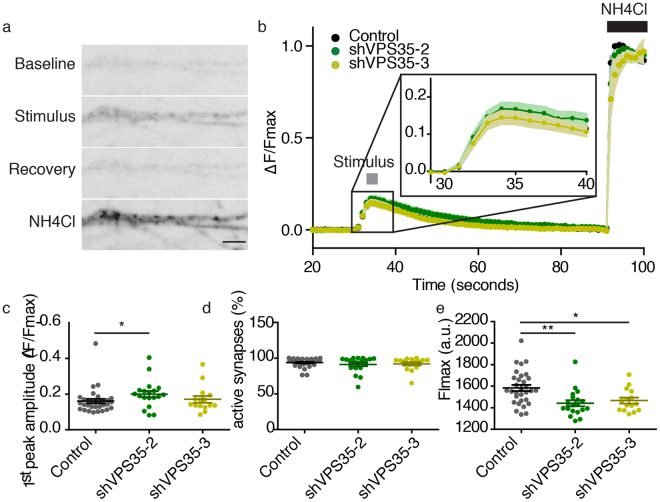
Figure 5.
VPS35 KD does not affect SypHy release or retrieval. (a) Representative sypHy fluorescence images of neurites during baseline, stimulation, the recovery period and the exposure to NH4Cl. Scale bar = 10 µm. (b) Time course of sypHy fluorescence during the imaging protocol, plotted as ΔF/Fmax. The grey box indicates the electrical stimulation (100 AP, 40 Hz, 30 mV) and the black box the exposure to 10 seconds of NH4Cl (n = 23 ± 8 fields of view, N = 4 animals). (c) Maximum response amplitude during the electrical stimulation plotted as ΔF/Fmax. (d) Percentage of responsive synapses during the stimulation. (e) Maximum response to the exposure to NH4Cl. Detailed information (average, SEM, n and statistics) is shown in Supplementary Table S1.

