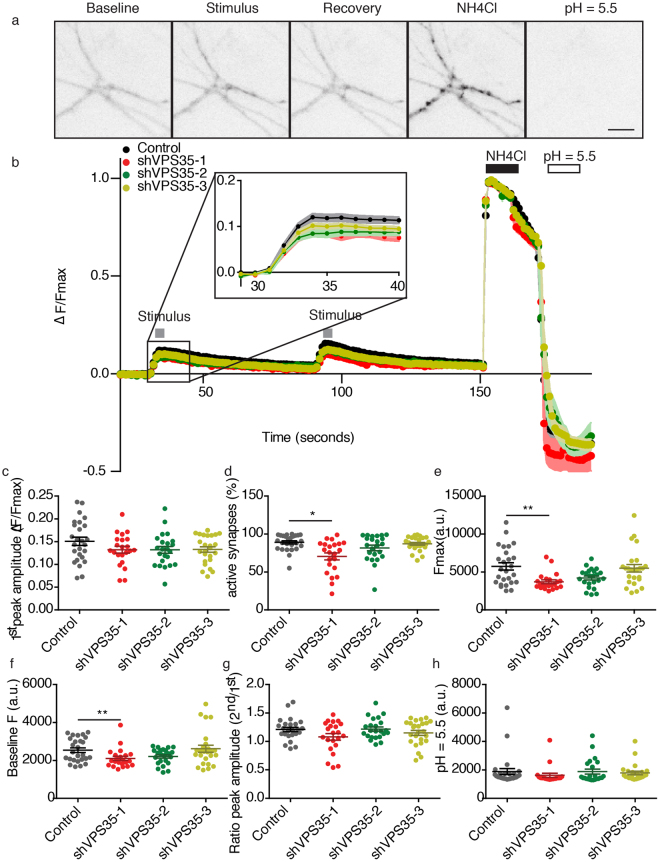
Figure 6.
Repetitive stimulation does not induce presynaptic failure in VPS35 KD neurons. (a) Representative synaptopHluorin fluorescence images of neurites during the base line, the first stimulation, the first recovery period, the exposure to NH4Cl and the exposure to pH = 5.5. Scale bar = 40 µm. (b) Time course of synaptopHluorin fluorescence during the imaging protocol, plotted as ΔF/Fmax. The grey boxes indicate the electrical stimulation (100 AP, 40 Hz, 30 mV each), the black box the duration of the exposure to NH4Cl and the white box the duration of the exposure to pH = 5.5. (n = 24 ± 2 fields of view, N = 3 animals). (c) Maximum response amplitude during the electrical stimulation plotted as ΔF/Fmax. (d) Percentage of responsive synapses during the stimulation. (e) Maximum synaptopHluorin levels during exposure to NH4Cl. (f) Average fluorescence of synaptopHluorin during baseline recordings. (g) Ratio of the maximum synaptopHluorin fluorescence amplitude between the first and the second electrical stimulation. (h) Minimum response to the exposure to pH = 5.5. Detailed information (average, SEM, n and statistics) is available in Supplementary Table S1.

