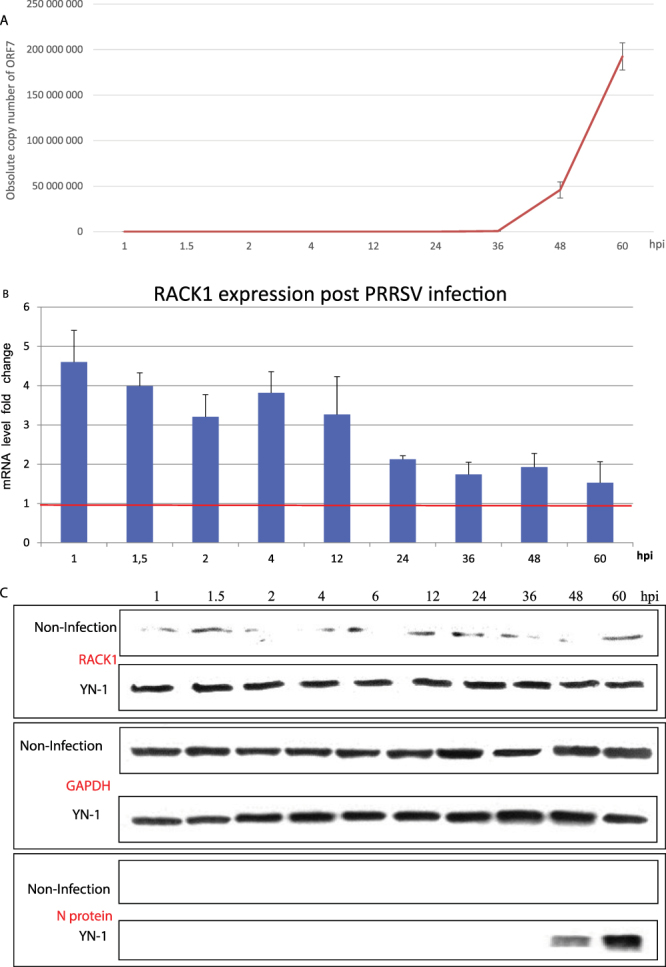
Figure 2.

PRRSV infection in Marc-145 cells upregulated RACK1 expression on both mRNA and protein level. After challenge with PRRSV YN-1 strain (25 TCID50) in Marc-145 cells, total RNA was isolated at different time points for RT-qPCR analysis and the total protein was extracted for western blot analysis. (A) Absolute copy number of viral ORF7 mRNA over 60 hours’ infection time. The p value between the two datasets (1, 1.5, 2, 4, 12, 24, 36 hpi and 48, 60 hpi) is 0.0068, indicating a significant difference. (B) Relative mRNA expression level of RACK1. The ΔΔCt method for relative quantification of gene expression was used to determine viral ORF7 RNA levels. (C) Western blot analysis of RACK1 and viral N protein. After SDS-PAGE and protein transferring, the membranes were cut based on the molecular weights of the target proteins and the markers, put together along the same film for exposure with same exposure time for each sub-figure. The histograms and blots shown here are representative data from three independent experiments. GAPDH was used as internal control in both RT-qPCR and western blot analysis.
