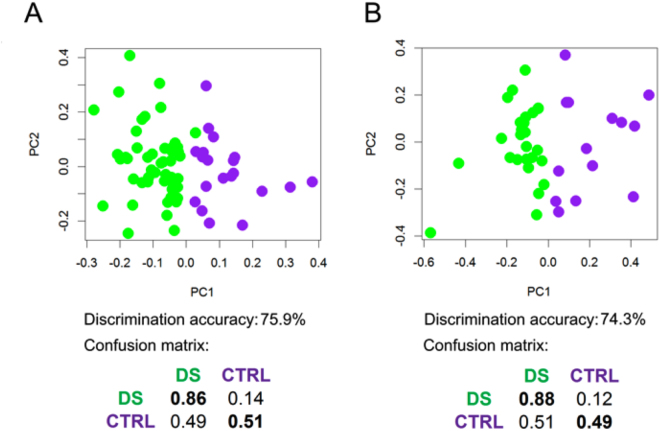
Figure 2.
PLS-CA analysis of urine samples. 1Dpresat NOESY spectra. Score plot, PC1 vs PC2, and corresponding confusion matrices. In the score plot, each dot represents a different urine sample. Green dots: DS samples; purple dots: healthy controls. (A) All samples (DS, n = 51; CTRL, n = 20); discrimination accuracy: 75.9% (95% CI, 75.5–76.2%); sensitivity: 85.6% (95% CI, 85.2–86.1%); specificity: 50.9% (95% CI, 49.9–51.8%). (B) Samples from fasting subjects (DS, n = 26; CTRL, n = 14); discrimination accuracy: 74.3% (95% CI, 73.7–74.8%); sensitivity: 87.9% (95% CI, 87.3–88.5%); specificity: 48.9% (95% CI, 47.7–50.2%).

