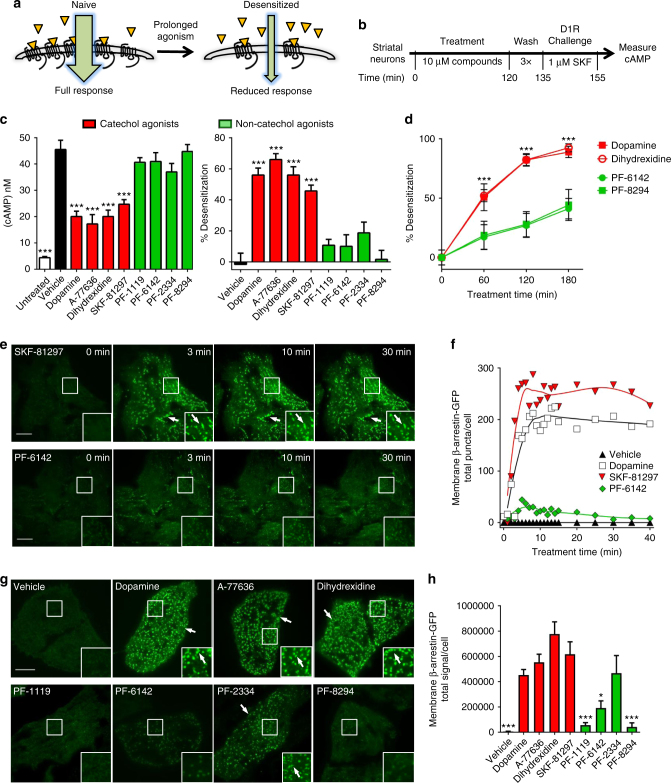
Fig. 2.
Non-catechol D1R agonists fail to induce desensitization via impaired β-arrestin recruitment. a Schematic of agonist-stimulated desensitization of GPCRs. Prolonged activation reduces subsequent agonist-induced signaling. b Experimental design to test for agonist-stimulated D1R desensitization. c Agonist-induced (1 μM SKF-81297) cAMP elevation and percent desensitization of D1 receptor signaling in striatal neurons treated for 120 min with vehicle or 10 μM of the indicated agonists. One-way ANOVA revealed a significant effect of treatment on cAMP levels, F(9, 108) = 32.1, P < 0.001; post-hoc Dunnett’s comparisons indicated only catechol agonists had significantly different level of cAMP versus vehicle (***P < 0.001). Percent desensitization was significantly affected by treatment (one-way ANOVA F(8,99) = 24.2, P < 0.0001); Dunnett’s comparisons indicated significantly higher percent desensitization in all catechol groups versus vehicle (***P < 0.001), while non-catechol groups were not significantly different from vehicle. All data represent means ± s.e.m., n = 3 per group. d Percent D1 receptor desensitization after various times of agonist exposure. Two-way ANOVA revealed significant trends in time (linear F(1,59) = 44.2, P < 0.0001 and quadratic F(1,59) = 8.5, P < 0.005) and significant interaction effect (F(3,59) = 5.1, P < 0.003); pairwise Tukey post-hoc tests at time points 60,120, and 180 min indicated that catechol and non-catechol groups were significantly different (***P < 0.001, n = 4 per group; batches are independent from panel c). e Live cell total internal reflection fluorescence microscopy (TIRFM) imaging of β-arrestin-GFP recruitment to the plasma membrane of U2OS cells expressing human D1R. Images show β-arrestin-GFP at the plasma membrane of cells before and after exposure to the indicated agonists (1 μM). f Quantification of membrane β-arrestin-GFP puncta in the cells shown in e. g TIRFM images of β-arrestin-GFP at the plasma membrane in U2OS cells after 10 min of treatment with indicated agonists (1 μM). Scale bars, 10 μm. h Quantification of β-arrestin-GFP membrane recruitment via total signal per cell from ≥60 cells per group obtained across three independent experiments. One-way ANOVA revealed that treatment had a significant effect (F(9,33) = 130.9, P < 0.0001; Dunnett’s comparisons with dopamine group indicated significantly lower total signal in vehicle, PF-1119, PF-8294 (***P < 0.001) and PF-6142 (*P < 0.05), but not in PF-2334, and not for all catechol agonists groups. All data represent means ± s.e.m., n ≥ 3

