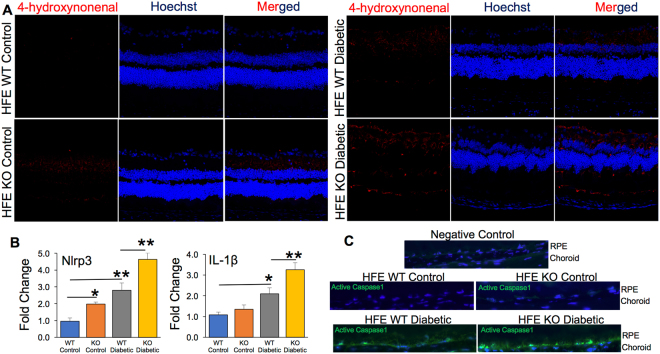
Figure 5.
Increased oxidative stress and NLRP3 inflammasome activation in retina of diabetic HFE KO mouse model of iron overload. (A) 4-Hydroxynonenal staining in non-diabetic control and diabetic HFE WT and KO mouse retina. (B) Expression levels of NLRP3 and IL-1ß mRNA in non-diabetic control and diabetic HFE WT and KO mouse retina by RT-PCR (C) Active caspase-1 levels detected using the FAM-FLICA Assay Kit (green). Data are presented as mean ± S.E. *p < 0.01, **p < 0.001.

