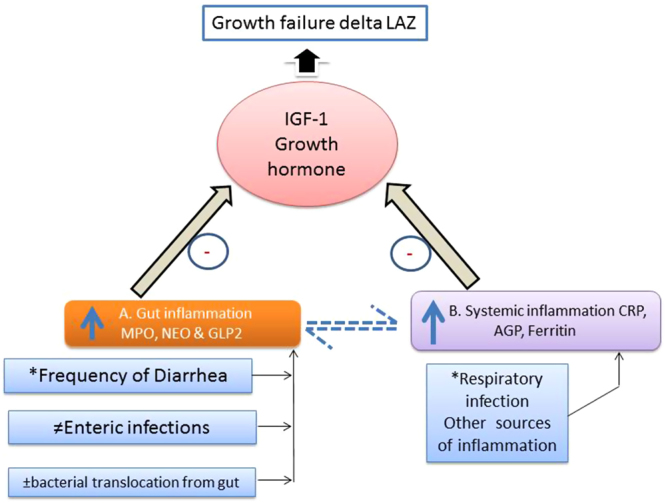
Figure 3.

Framework of EED showing gut/systemic inflammation influencing growth in children. This figure describes the hypothetical pathway of EED through the gut (A) and systemic inflammation (B). Factors driving the inflammatory pathway include respiratory illnesses, enteropathogen infection (measured by TaqMan Array), translocation of bacteria from the gut (IgG/IgA against LPS and Flagellin) due to repeated diarrheal episodes. The two distinct pathways regulating growth hormone, are being measured by gut-specific and systemic biomarkers shown in boxes (A) & (B). The negative association of biomarkers with IGF results in growth failure in children as shown by the black arrow. The dotted arrows show a weak relationship between the gut and systemic inflammatory biomarkers. *Information collected through weekly morbidity data. ≠Estimated through TaqMan array card for bacterial, viral and protozoal targets at 6 and 9 month fecal samples. ±IgG/IgA antibodies against LPS and Flagellin was measured in serum samples at 6 and 9 months.
