Figure 5.
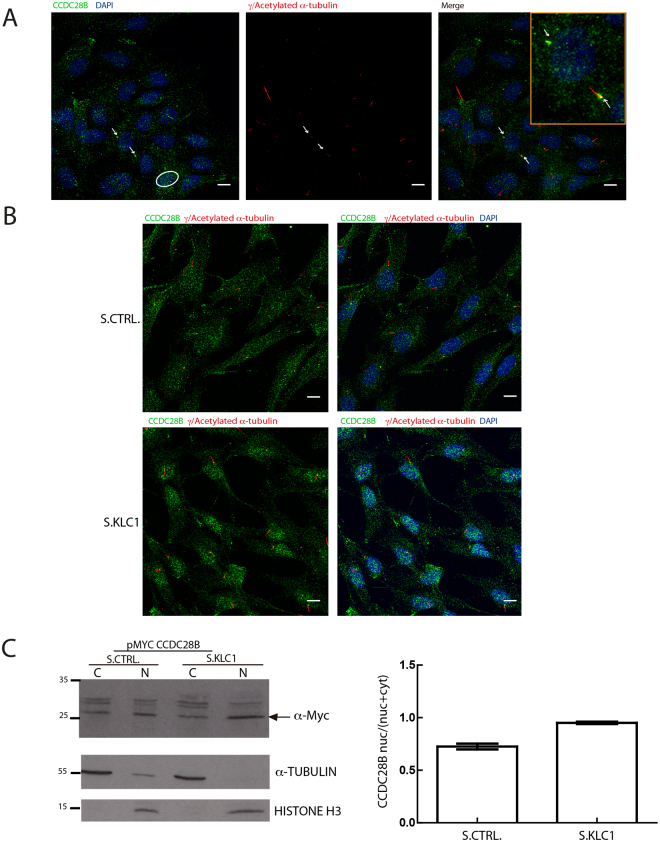
KLC1 plays a role regulating the sub-cellular distribution of CCDC28B. (A) Confocal microscopy analysis of endogenous CCDC28B (green) in hTERT-RPE cells showing localization of the protein in the cytoplasm, pericentriolar region/basal body (arrows illustrate examples in a ciliated and a non-ciliated cell, higher magnification in yellow box) and the nucleus (circle). Basal bodies and cilia axoneme were stained with anti-γ- and anti-acetylated α-tubulin respectively (red). (B) CCDC28B (green) signal is increased in the nucleus upon KLC1 KD (S.KLC1; lower panels) compared to control cells (S.CTRL; upper panels). In both (A,B), DAPI was used to stain nuclei. Scale bars correspond to 10 μm. (C) Sub-cellular fractionation assay using hTERT-RPE cells transfected with a Myc-CCDC28B expressing plasmid together with stealth control (S.CTRL) or stealth KLC1 (S.KLC1). CCDC28B is present in both the cytosolic and nuclear fractions in control cells and accumulates in the nuclear fraction in KLC1 KD cells. The membrane was cut at the 35 KDa ladder band. The blot incubated with the α-Myc to visualize CCDC28B was stripped and probed with α-Histone. The graph shows the nuclear/total (nuclear + cytoplasmic) ratio obtained by quantifying the western blot bands by densitometry. α-tubulin was used to normalize the nuclear intensity of CCDC28B and compensate for the cytosolic contamination in the nuclear fraction.

