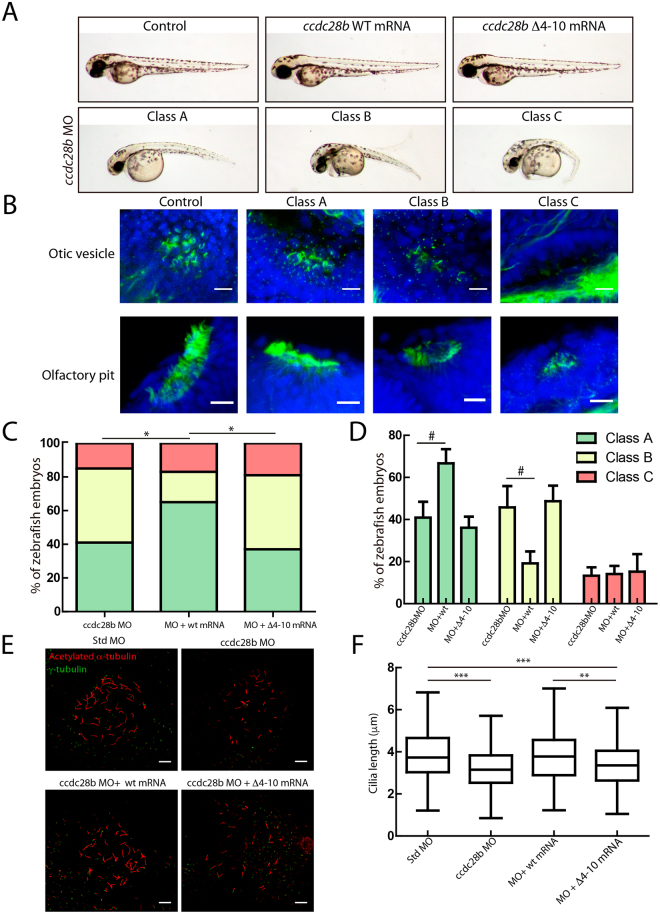
Figure 6.
A Δ4–10 ccdc28b mutant does not rescue the morphant phenotype in zebrafish. (A) 48 hpf control and injected zebrafish embryos are shown. While injecting either wt or mutant ccdc28b mRNA does not result in phenotypic alterations, injection of the ccdc28b MO results in a range of phenotypes from mild to severe corresponding to Class A to C respectively. Representative images of each class are shown. (B) The severity of the external morphological phenotype in the different classes correlates with an increasing perturbation of ciliated tissues. Otic vesicle and nasal pit are shown. (C) The class distribution upon injection of morpholino alone (ccdc28b MO) and morpholino co-injected with either wt or Δ4–10 mutant ccdc28b mRNA was compared. Data from five independent injections were pooled reaching 128 ccdc28b MO, 65 ccdc28b MO + wt mRNA and 63 ccdc28b MO + Δ4–10 ccdc28b mRNA embryos. A rescue of the phenotype was observed only upon injecting the wt mRNA but not the Δ4–10 mutant. Statistical test: χ2; *P < 0.01. (D) The percentage of embryos in each phenotypic class was calculated for the five individual experiments. The mean and SEM (bars) are plotted. The differences between conditions (#) were analyzed using the Wilcoxon rank test (P = 0.06 for class A; P = 0,05 for class B) and paired t-test assuming normal distribution (P = 0.02 for both class A and class B). (E) Cilia and basal bodies in KV were visualized with anti-acetylated (red) and anti-γ-tubulin (green) respectively. Representative images for control, ccdc28b MO, and ccdc28b MO embryos co-injected with either ccdc28b wt or Δ4–10 mRNA. (F) Cilia length was measured using ImageJ (355 cilia for Std. MO, 336 for ccdc28b MO, 276 for ccdc28b MO + wt mRNA, 266 ccdc28b MO + Δ4–10 mRNA). Cilia are significantly shorter in ccdc28b MO embryos and length is rescued upon co-injection of wt ccdc28b mRNA but not with the Δ4–10 ccdc28b mRNA. Statistical test: Kruskal Wallis. **P < 0.01, ***P < 0.001. Scale bars correspond to 10 μm.

