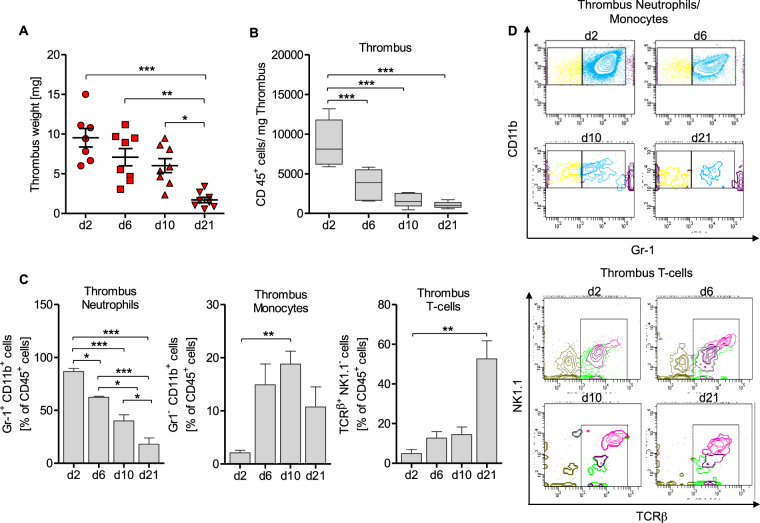
Figure 1.
The distribution of inflammatory cells changes in the resolution process. In the IVC-stenosis model thrombus weight decreases during a time period of 21 days (A) as well as the total cell count of CD45+ cells/mg thrombus (B). Results are shown as median with interquartile range, n = 5 to 6 animals per group. One way-ANOVA/Bonferroni’s Multiple Comparison test; *p ≤ 0.05; **p ≤ 0.01; ***p ≤ 0.001. The flow-cytometric analysis of CD45+CD11b+Gr-1+ neutrophils, CD45+/CD11b+/Gr-1− monocytes and CD45+/CD11b−/TCRβ+ T-cells in thrombus tissue reveals different peaks of these cells during a time course of day 2, 6, 10 and 21 (C). Results are shown as mean ± SEM, n = 5 to 6 animals per group. One way-ANOVA/Bonferroni’s Multiple Comparison test; *p ≤ 0.05; **p ≤ 0.01; ***p ≤ 0.001. (D) Representative FACS-plots of CD11b+/Gr-1+ neutrophils (blue), CD11b+/Gr-1− monocytes (yellow) and NK1.1−/TCR beta+ T-cells in thrombus material (day 2, 6, 10, 21 post subtotal ligation) of C57BL/6 mice.

