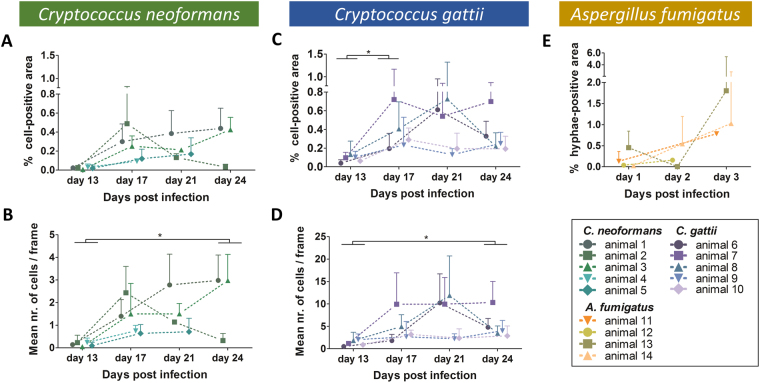
Figure 5.
Quantitative analysis of the in vivo bronchoscopic FCFM images showing differences during the course of infection. For each animal, three different image sequences were acquired per time point. Subsequently, both the number of cells and the percentage cell-positive area per frame were quantified and averaged for each image sequence, resulting in three values per mouse per time point. (A–D) Graphs representing the percentage cell-positive area and mean number of cells per frame quantified for the individual C. neoformans infected animals (green, n = 5) or C. gattii infected animals (blue, n = 5), respectively. (E) Graph representing the percentage hyphae-positive area calculated for the A. fumigatus infected animals (n = 5). Data are shown as mean ± SD. Differences over time were analysed using a Friedman test (repeated measures) or a Kruskal-Wallis test (in case of missing values due to animal death or failed acquisition) with Dunn’s multiple comparison post-test (*p-value < 0.05).

