Figure 6.
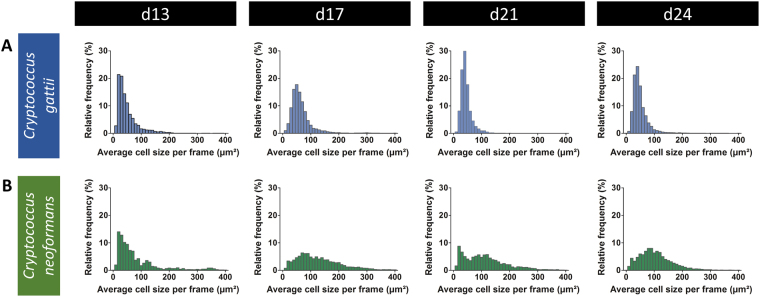
Quantitative analysis of the size distribution of cells detected on the in vivo bronchoscopic FCFM images. The average cell size per frame of all frames and animals were pooled per time point to obtain a relative frequency distribution of cell sizes. Frames containing zero detected cells or having a mean signal intensity lower than 5 were excluded from the analysis. Histograms (bin width of 10 µm²) representing the average cell size per frame on day 13, 17, 21 and 24 post instillation with C. gattii (top row) or C. neoformans (bottom row) show a wider variation in cell sizes for C. neoformans.

