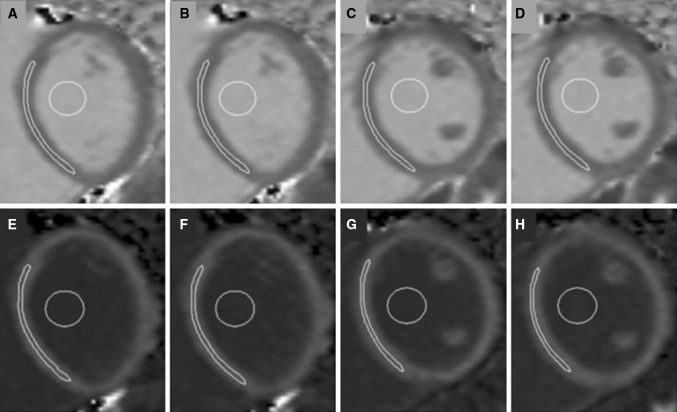
Fig. 1.
Representative short axis images from a healthy volunteer with native T 1 maps (a–d) and post gad T 1 maps (e–h). One basal and one mid-ventricular level were selected and imaging at each level was repeated both before and after the administration of Gd (a, b native T 1 basal; e, f post-Gd basal; c, d native T 1 mid-ventricular level, g, h, mid-ventricular level post-Gd). Regions of interest (ROI) were drawn in the myocardium and blood

