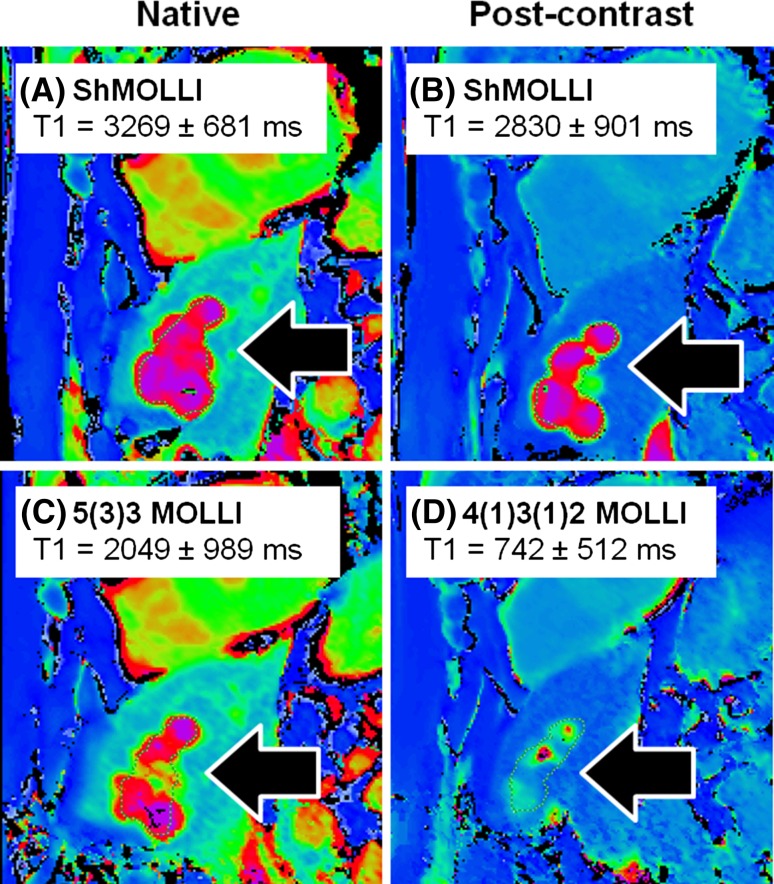
Fig. 2.
Characterizing tissues with very long T1 values using different T1 mapping techniques. Shown are T1 maps from a patient with a past history of breast cancer. Liver cysts (black arrows) observed with ShMOLLI retains the characteristic very long T1 both pre- (a) and post-gadolinium-based contrast due to its consistent performance over a wide range of heart rates and T1 values. In c, the 5(3)3 MOLLI variant pre-contrast T1 map shows ~30% lower T1 in the liver cysts, consistent with the back-loaded 11-heartbeart MOLLI 3(3)5 variant [4]. d Post-contrast T1 map using the 4(1)3(1)2 MOLLI variant dedicated for post-contrast applications suffers substantial underestimation of cystic T1 by >70%. Comparing c and d, cystic lesions may appear to take up gadolinium-based contrast agents (GCBAs), which may suggest a tumour with communication to the vasculature, rather than what would be expected for a cyst. T1 is quoted for manual regions of interests drawn within the cysts. Colour tables are identical for all panels shown, as in Siemens ShMOLLI distributions for ease of comparisons

