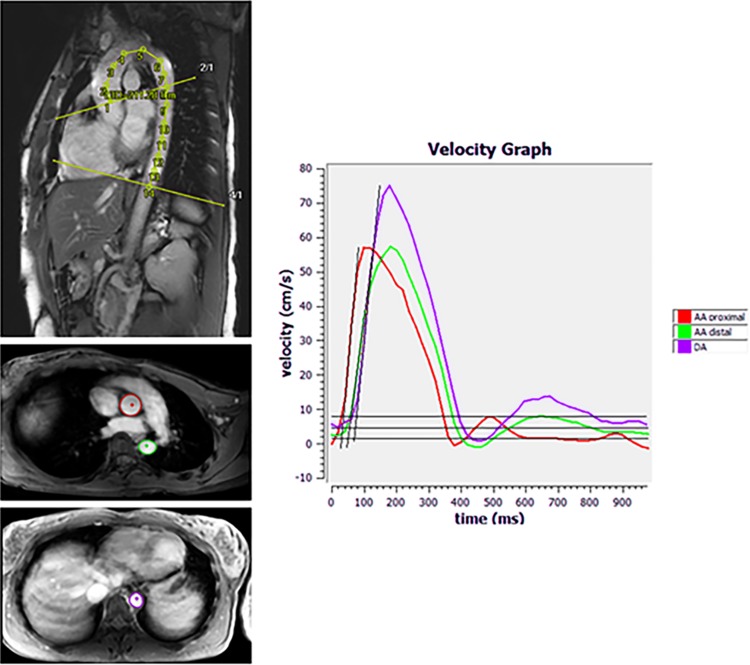
Fig. 2.
Example of double oblique, through-plane velocity-encoded images and of PWV measurement (32-year-old female participant). Upper left illustration of traced double oblique image. Tracing was performed along the centerline of the aorta to measure aortic lengths. Middle/lower left illustration of traced through-plane images. Contours were traced in the ascending and proximal descending aorta (acquisition 1 middle left) and near the dome of the liver (acquisition 2 lower left) for aortic velocity mapping. Right example of velocity graph, generated using PWVAppStatic. PWV of the total thoracic aorta was measured using linear modelling

