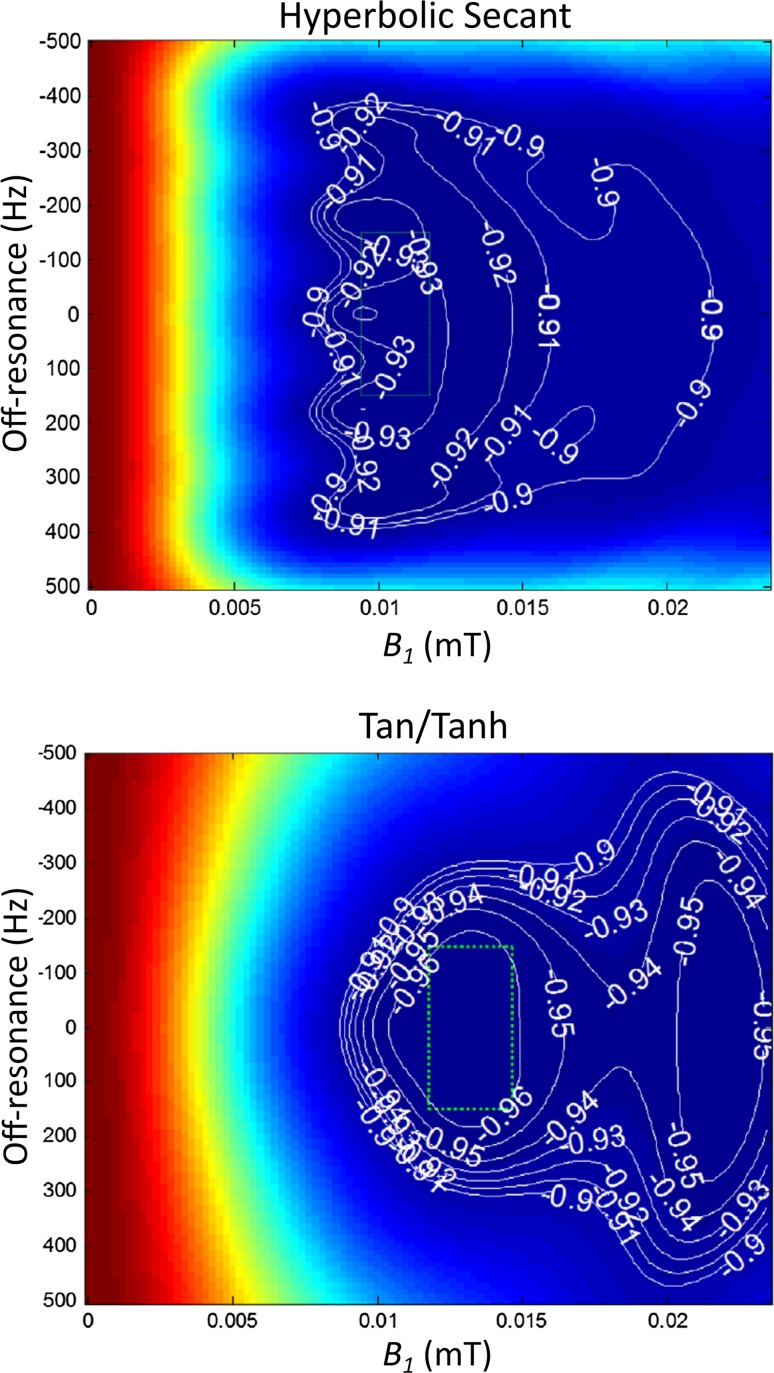
Fig. 1.
Inversion pulse performance. Plots show the response to B 0 (vertical) and B 1 (horizontal) of two different adiabatic inversion pulse designs: Hyperbolic Secant and Tan/Tanh (T 1 = 1000 ms, T 2 = 45 ms). A contour value −1.0 would indicate perfect inversion. The “design region”, enclosing the maximal likely in vivo cardiac B 0 and B 1 distortion, is represented by the dotted green box.
Adapted with permission from Kellman et al. [40]

