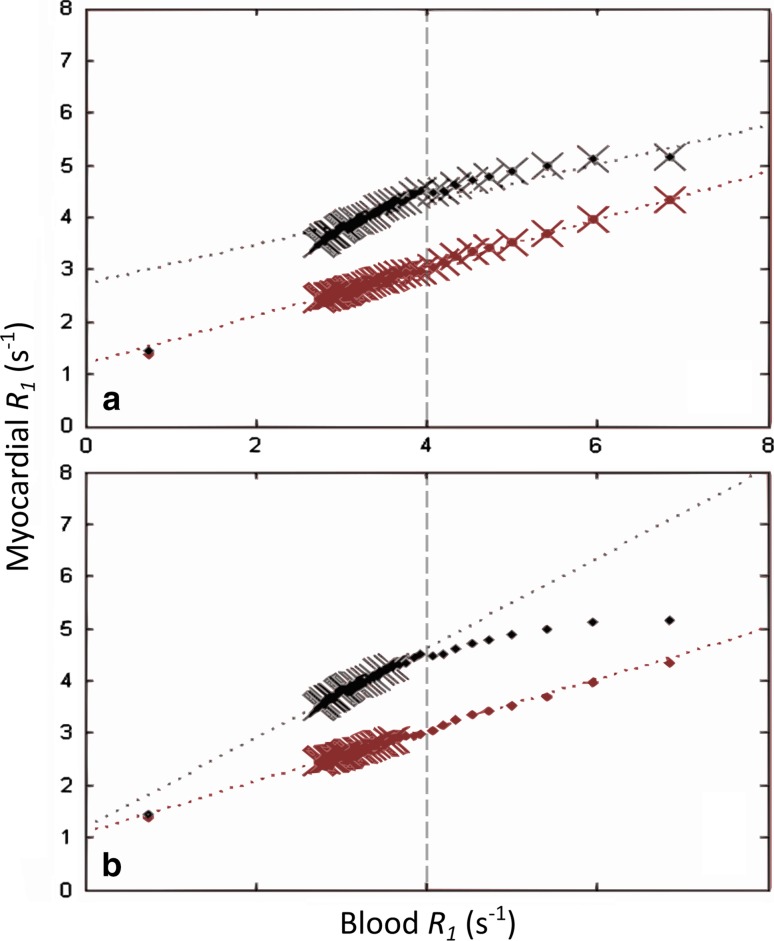
Fig. 5.
Estimation of partition coefficient in chronic myocardial infarction patients. Plots show myocardial relaxation rate (R 1) versus blood R 1 in viable and infarcted myocardium (red and black points, respectively) for two different post-contrast serial acquisition schemes. Note that the slopes of the linear regressions (partition coefficients, λ, indicated by dotted lines) change considerably depending on the sampled points (crosses) for infarcted tissue, but remain relatively constant in viable myocardium. Plot (a) used time points from 1 to 40 min for partition coefficient estimation, which gave λ = 0.46 in viable myocardium and 0.38 in infarct. Plot (b) used time points from 15 to 40 min for linear regression, leading to λ = 0.49 in viable tissue and 0.86 in infracted tissue. Dashed grey lines indicate the cut-off R 1 of 4 s−1, above which points are generally excluded to avoid nonlinearity of λ (Jerosch-Herold, personal communication).
Adapted with permission from Goldfarb and Zhao [90]

