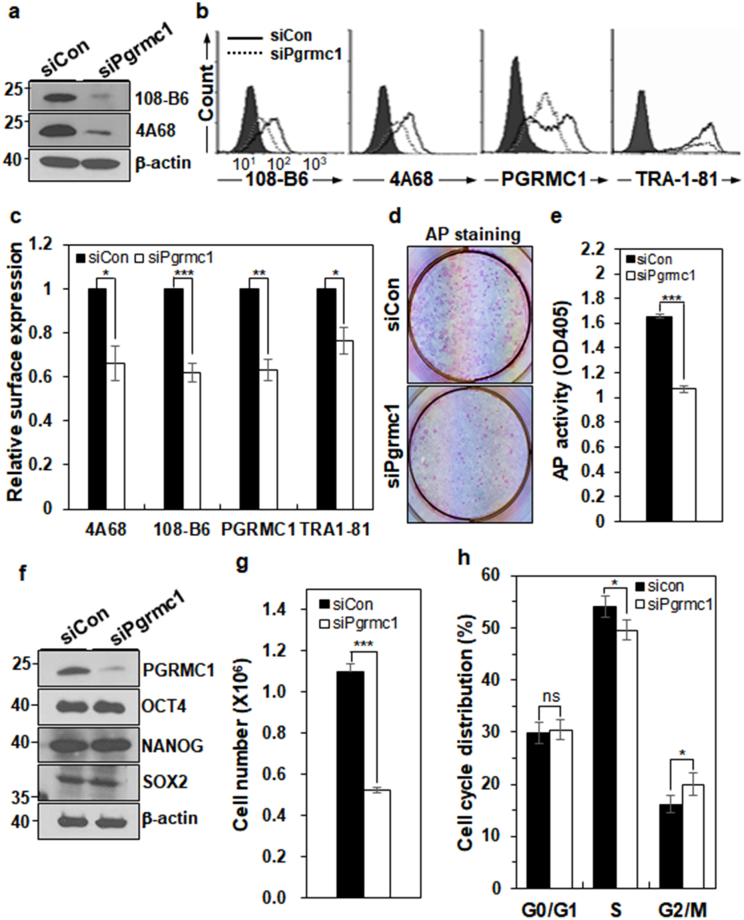
Figure 4.
PGRMC1 knockdown impairs hPSC self-renewal and proliferation. (a) Knockdown of PGRMC1 in H9 hPSCs. H9 cells were transfected with either control siRNA (siCon) or PGRMC1 siRNA (siPgrmc1) for 72 h, and subjected to Western blot analysis with 108-B6 and 4A68, followed by HRP-conjugated anti-mouse IgG. Full-length blots are presented in Supplementary Figure 8. (b) Flow cytometric analysis of cell surface PGRMC1 and TRA-1-81 on the surface of H9 cells transfected with siCon or siPgrmc1. Transfected-H9 cells were incubated with 108-B6, 4A68, α-PGRMC1 or anti-TRA-1-81 antibodies, and detected by appropriate FITC-conjugated secondary antibodies. (c) Graphic presentation of cell surface expression of PGRMC1 and TRA-1-81 in siCon or siPgrmc1 knockdown hESCs. Relative expression of cell surface PGRMC1 and TRA-1-81 was measured by MFIs of flow cytometry and normalized for control secondary antibody binding. The graph represents the mean values of three independent determinations ±SD (n = 3; *p < 0.05; **p < 0.01; ***p < 0.005). (d) AP staining of siCon or siPgrmc1 knockdown hPSCs. H9 cells were pre-treated with Y-27632, dissociated into single cells, and transfected with siCon or siPgrmc1. After culturing for 7 days, visible colonies were stained with AP assay kit. (e) Statistical analysis of AP activity of control or PGRMC1 knockdown hPSCs. AP activity of AP-positive colonies was measured at OD405 (n = 7; ***p < 0.005). (f) Western blot analysis showing the expression levels of OCT4, NANOG, SOX2, and PGRMC1 in control or PGRMC1 knockdown hPSCs. β-actin was used as internal protein control and loading control. Full-length blots are presented in Supplementary Figure 8. (g) Cell proliferation of control or PGRMC1 knockdown hESCs. Cell numbers of control or PGRMC1 knockdown hPSCs were determined by trypan blue exclusion assay (n = 7; ***p < 0.005). (h) Cell cycle distribution of control or PGMC1 knockdown hPSCs. Each bar represents mean values of four independent experiments ± SD (n = 4; *p < 0.05; ns, not significant). In (a,f), images are representative of at least three independent experiments.

