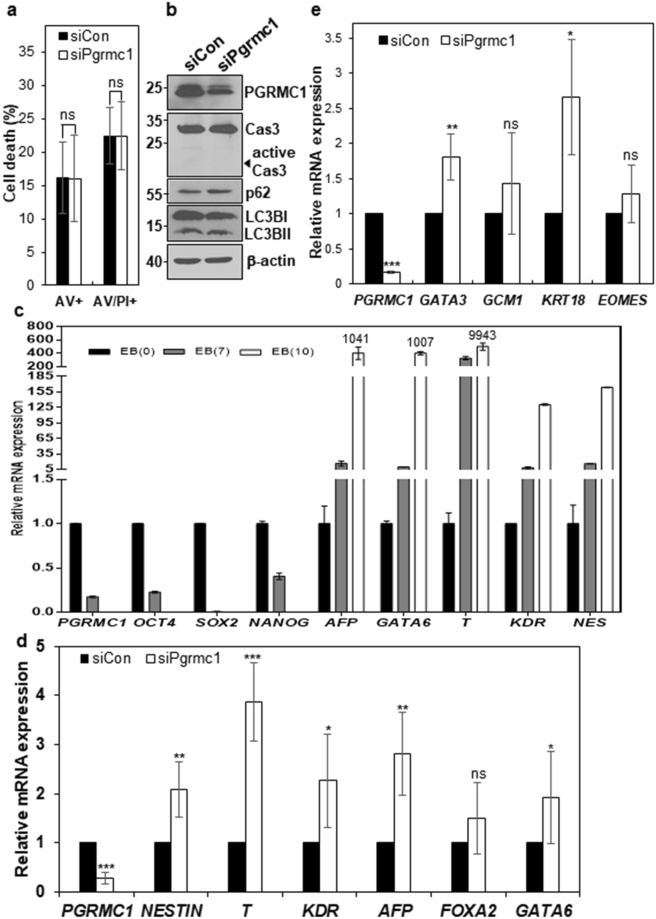
Figure 5.
PGRMC1 knockdown drives differentiation of hPSCs into multi-lineage cells. (a) Flow cytometric analysis of early and late apoptotic cells with annexin V and PI. Control or PGRMC1 knockdown H9 hPSCs were stained with PI and annexin V-FITC. Shown is statistical analysis of single annexin V-positive (AV+) and both annexin V- and PI-positive cells (AV+PI+). Each bar represents the mean value of three independent experiments ± SD (n = 4; ns, not significant). (b) The expression levels of caspase-3, active caspase-3, p62 and LC3B in control and PGRMC1 knockdown hPSCs. β-actin was used as internal protein control and loading control. Full-length blots are presented in Supplementary Figure 8. Images are representative of at least three independent experiments. (c) Real-time PCR analysis of mRNA levels of early differentiation genes in EB of hPSCs. EBs were cultured for 7 and 10 days. The graph represents the mean values of two independent determinations ± SD. (d) Real-time PCR analysis of mRNA levels of early differentiation genes in control or PGRMC1 knockdown hPSCs. The graph represents the mean values of seven independent determinations ±SD (n = 7; *p < 0.05; **p < 0.01; ***p < 0.005). (e) Real-time PCR analysis of mRNA levels of trophectoderm genes in control or PGRMC1 knockdown hPSCs. The graph represents the mean values of 5 independent determinations ± SD (n = 5; ***p < 0.005; ns, not significant).

