Figure 1.

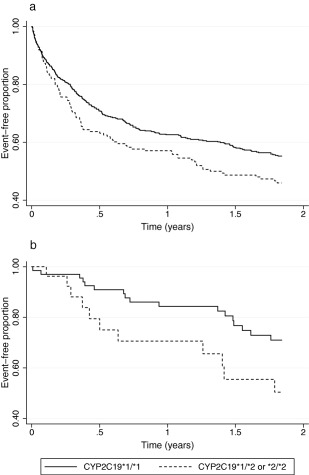
Kaplan‐Meier curves of all arterial thrombo‐occlusive events and death for (a) the whole clopidogrel‐treated population and (b) the ischemic stroke subpopulation.

Kaplan‐Meier curves of all arterial thrombo‐occlusive events and death for (a) the whole clopidogrel‐treated population and (b) the ischemic stroke subpopulation.