Fig. 3.
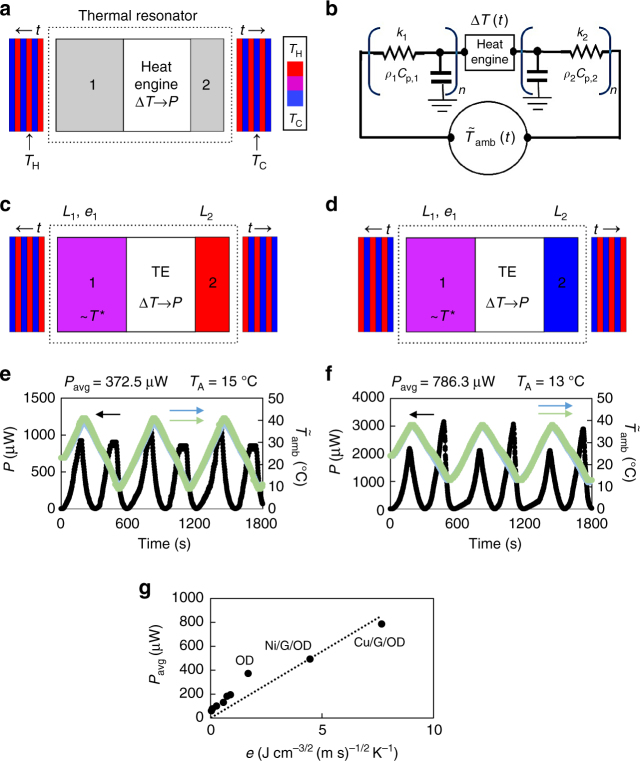
Application of ultra-high thermal effusivity materials in a thermal resonator. a A general schematic of a thermal resonator. A heat engine is encased between two thermal masses (1 and 2), which convert input temperature fluctuations—shown here as oscillating in time (t) between hot (red; TH = T0 + TA) and cold (blue; TC = T0 − TA)—into a spatial temperature difference, , that is converted to power (P) by the heat engine. b A thermal circuit demonstrating the operation and modeling details of a thermal resonator. Input, temperature fluctuations, , are applied and transformed into a spatial temperature difference by tuning the system’s thermal resistances and capacitances . c, d General schematics of a thermal resonator resembling the devices constructed and tested in this work, which incorporate a high thermal effusivity PCM as thermal mass 1 and a negligible thermal mass as 2. The schematics are similar to a, except the heat engine has been replaced by a thermoelectric (TE) and the anticipated temperature distribution throughout the device has been shown. Thermal mass 2 quickly responds to the temperature of the environment (hot, c or cold, d). Thermal mass 1 has a phase transition temperature (T*) near the median temperature of oscillations and mainly exists at this temperature. e Power profile (black) and input temperature profiles (blue, green) for a thermal resonator incorporating OD as thermal mass 1 (Supplementary Note 7). The time-averaged power output (Pavg) and temperature oscillation amplitude (TA) are also provided. f Power profile (black) and input temperature profiles (blue, green) for a thermal resonator incorporating Cu/G/OD as thermal mass 1 (Supplementary Note 7). The time-averaged power output (Pavg) and temperature oscillation amplitude (TA) are also provided. g Time-averaged power output (Pavg) of thermal resonators as a function of the thermal effusivity of thermal mass 1 (Methods, Supplementary Note 6). The linear fit of the data with the intercept forced through the origin is also shown, and the slope of the fit is 111, with the units determined by the axes. The six unlabeled data points in ascending order of thermal effusivity correspond to styrofoam, neoprene foam, wood, PVC, Teflon, and neoprene rubber. For PCMs (OD, Ni/G/OD, Cu/G/OD), thermal effusivity is given by Supplementary Eq. (16)

