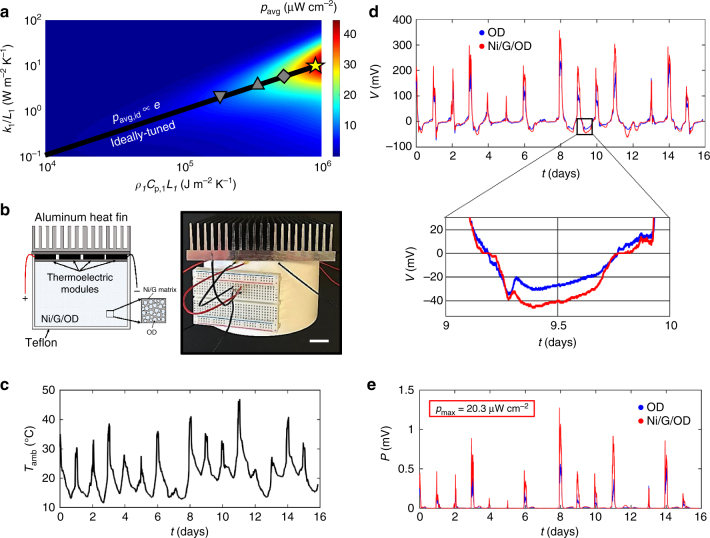
Fig. 6.
Reduction to practice of a power-optimized and tuned diurnal thermal resonator. a Heat map for the harvestable power density (pavg) from diurnal temperature fluctuations as a function of quantities related to the thermal resistance and thermal capacitance of thermal mass 1. The heat map assumes a diurnal temperature oscillation frequency , , and a temperature oscillation magnitude TA = 10 °C. The gray triangle , gray triangle (Δ), gray square, and yellow star correspond to ideally tuned dry soil, wet soil, OD, and Ni/G/OD thermal resonators, respectively. b Diurnal thermal resonance devices (schematic, left; photo, right) constructed from a hollow Teflon cylinder (height = 7.6 cm; diameter = 12.7 cm) and a 14 cm × 14 cm × 2.5 cm aluminum heat fin with four 4.0 cm × 4.0 cm Bi2Te3 commercial thermoelectrics wired in series as the heat engine situated between the thermal masses. The hollow Teflon cylinder contains stacked Ni/G/OD (26 pieces, diameter = 8 cm) as the phase change material. A control device containing pure OD was also constructed with the same dimensions (Methods, Supplementary Note 11). Scale bar: 2.5 cm. c Temperature profile of the transient, ambient environment where the diurnal thermal resonance devices were located over the course of 16 days in Cambridge, MA, USA, between 17 May and 2 June 2016. d Closed circuit voltage profiles for the diurnal thermal resonance devices when exposed to the ambient boundary conditions shown in c. e Power profiles for the diurnal thermal resonance devices when exposed to the ambient boundary conditions shown in c

