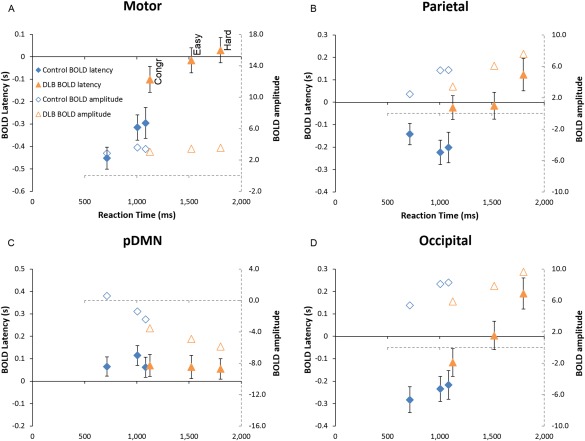
Figure 1.

Plot of BOLD latency and activation magnitude against reaction time to illustrate the repeated measures analysis presented in Tables 2 and 3, for the ROIs in the (A) motor cortex, (B) parietal lobe, (C) posterior default mode network (pDMN), and (D) occipital lobe. The 3 points per group (from left to right) are the congruent, easy, and hard incongruent conditions. Solid symbols are BOLD latency in seconds (on the left‐hand axis) and empty symbols are BOLD magnitude (on the right‐hand axis, with the dashed lines). The total range of the x‐axes is the same for all subplots. [Color figure can be viewed at http://wileyonlinelibrary.com]
