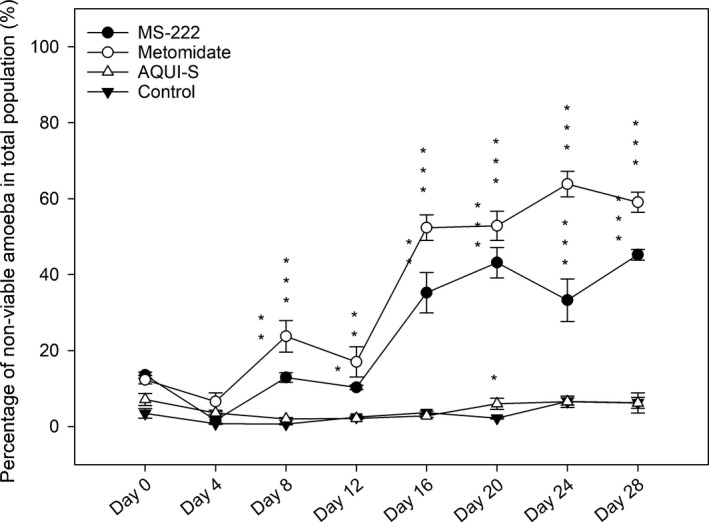
Figure 4.

Mean percentage of non‐viable amoebae present in the total amoeba population calculated from mean field of view counts of attached amoeba and suspended amoebae isolated in 200 μl aliquots taken from seawater overlay of the cultures. Data are means ± SE. * p < .05, ** p < .01, *** p < .001
