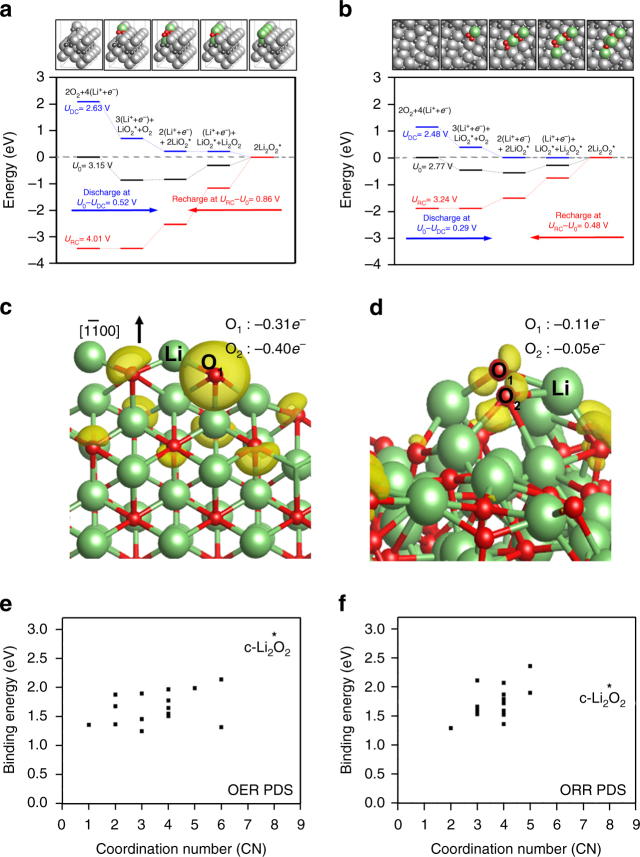
Fig. 4.
Density functional calculations and Bader charge analysis. a, b Calculated free energy diagrams a on the Li2O2 and b on amorphous Li2O2, along with the optimized structures. For the amorphous surface, the most favorable adsorption site was considered to construct the diagram. Lithium is colored in light gray (bulk) and light green (adsorbate); oxygen is colored in dark gray (bulk) and red (adsorbate). c, d The variation in electron density upon the first LiO2 adsorption on c the crystalline Li2O2 and d amorphous Li2O2 surfaces. The charge density indicated by surface contour is plotted with a threshold value of 0.01e Å−3. The newly adsorbing *LiO2 is denoted explicitly as Li, O1, and O2. O2 which is not shown in c is behind O1. Lithium is in light green and oxygen in red. e, f Binding energies of e 1st LiO2 and f 2nd LiO2 for 16 sites of the amorphous Li2O2 surface plotted versus coordination number. Binding energies on the crystalline surface are also shown for comparison, denoted as c-Li2O2

