
Figure 1.
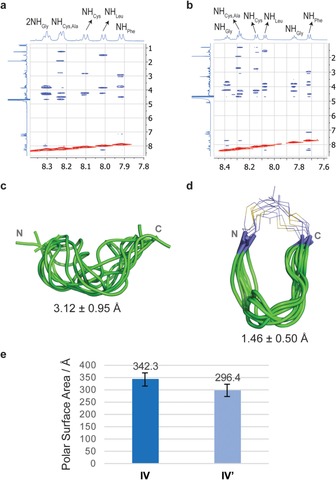
Conformation analysis of stapled and unstapled peptides in solution. Sections of the 500 ms ROESY spectra (400 MHz) of peptides A) IV and B) IV′ in H2O/D2O (9:1) at pH 6.5 and 20 °C, showing amide–aliphatic crosspeaks. Structural ensembles obtained for C) peptide IV and D) stapled peptide IV′ through 20‐ns MD‐tar simulations. The backbone is shown in green, and the carbon atoms of isobutylene moiety are in purple. The numbers indicate the rmsd for heavy‐atom superimposition of the backbone with respect to the average structure. E) PSA estimated for peptides IV and IV′ through the MD‐tar simulations.