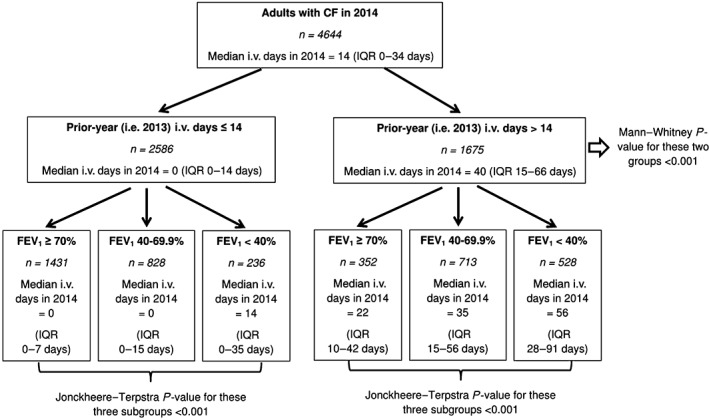
Figure 3.

Tree‐based diagram for 2014 to summarize current‐year i.v. days according to the different clinical subgroups. CF, cystic fibrosis; FEV1, forced expiratory volume in 1 s; IQR, interquartile range.

Tree‐based diagram for 2014 to summarize current‐year i.v. days according to the different clinical subgroups. CF, cystic fibrosis; FEV1, forced expiratory volume in 1 s; IQR, interquartile range.