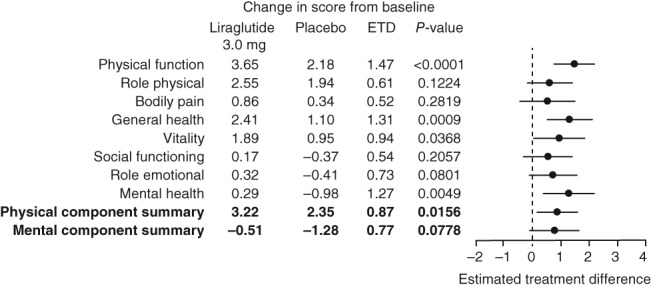
Figure 4.

SF‐36 ETD for physical component summary, mental component summary and subscale scores at 3 years. Change in score is the estimated mean change from baseline to Week 160; ETD; right panel shows estimated treatment difference ± 95% confidence intervals; missing data are imputed using last observation carried forward. The data are analysed using analysis of covariance (ancova) with treatment, country, gender, BMI stratification groups (<30, ≥30 kg m−2) as fixed factors, and baseline HRQoL scores (at Week 0) as covariates. BMI, body mass index; ETD, estimated treatment difference; SF‐36, Short‐Form 36 v2.
