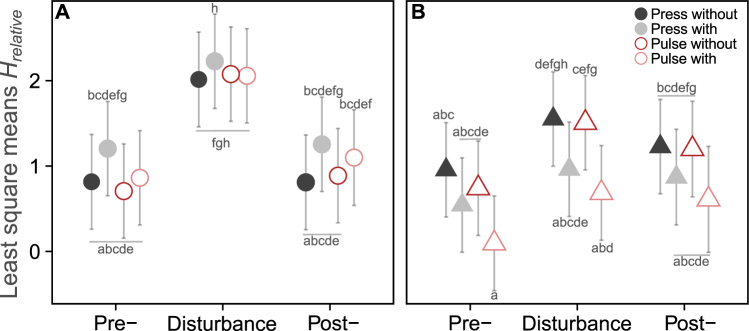
Figure 3.
Magnitude of change in prey diversity (H) relative to the control under different disturbance treatments in the absence (A) or presence (B) of a predator. Colors code for the disturbance treatments, “press” and “pulse” are the disturbance types, “with” indicates that the disturbance is coupled with a resource deprivation and “without” is without resource deprivation. Points represent least square means for each treatment and the error bars are the 95% confidence intervals. Bonferroni-Holm corrected multiple comparisons are shown as letters. Groups sharing the same letter are not detectably different.

