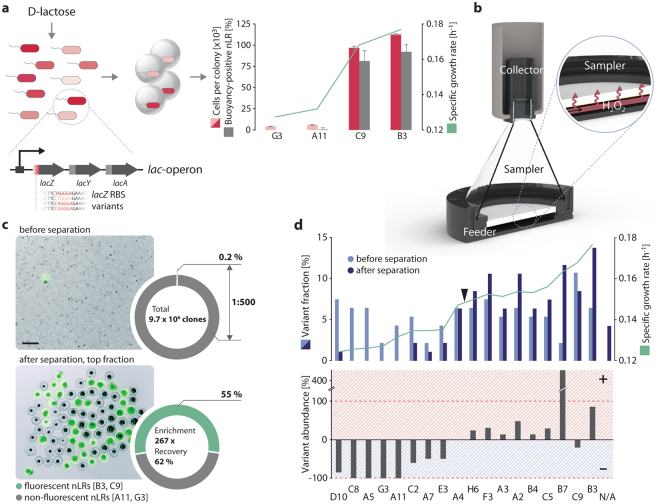
Figure 2.
Buoyancy separation of whole cell biocatalysts according to their growth rate. (a) The specific growth rate of E. coli EcNR1 variants on d-lactose was determined. Cells from two slow- (G3, A11) and two fast-growing (C9, B3) variants were expanded to microcolonies in nLRs. In the presence of H2O2, the majority of microcolonies formed from the fast-growing cells produced ascending nLRs (C9: 139 of 171; B3: 156 of 170) whereas the slow-growing cells did not (G3: 0 of 157; A11: 1 of 150). One-way ANOVA indicated a statistically significant difference among the different strains for both cells per colony (F(3,745) = 276.80, p < 0.00001, α = 0.01) and separation (F(3,32) = 373.25, p < 0.00001, α = 0.01). Data shown as mean ± SD, n = 9 with 14 to 21 nLRs per experiment. (b) Sectional drawing of the device used for separation (see also Supplementary Fig. 8). (c) The nLRs containing slow-growing strains were incubated in approx. 500-fold excess together with fast-growing strains until microcolonies had formed. Then, 1.73 × 10⁷ nLRs (with a total of 9.72 × 10⁶ microcolonies) were buoyancy-separated using the device shown in b. The nLRs containing the fast-growing variants B3 and C9 also carried a fluorescence label which allowed identifying the genotype by epifluorescence microscopy before (upper picture) and after (lower picture) separation (GFP filter set, see Supplementary Methods). A sample of 20,000 nLRs of the initially prepared total population and the entire buoyancy-positive top fraction (22,585 nLRs) were analysed by large particle sorting to determine the enrichment factor. Scale bar: 400 µm. (d) A total of approx. 16,000 cells representing 18 strain variants with different growth rates were distributed over approx. 50,000 nLRs and subjected to buoyancy separation after incubation. Specific genotypes in a subset (48 clones of each subset) of the total population before and after separation were determined (upper graph) and used for the calculation of the variant abundance (variants after separation x variants before separation−1 − 1, lower graph). The triangle indicates the specific growth rate of unmodified E. coli EcNR1. N/A: Samples with more than one genotype per nLR (e.g. nLRs that had received two or more library cells during inoculation).

