Figure 3.
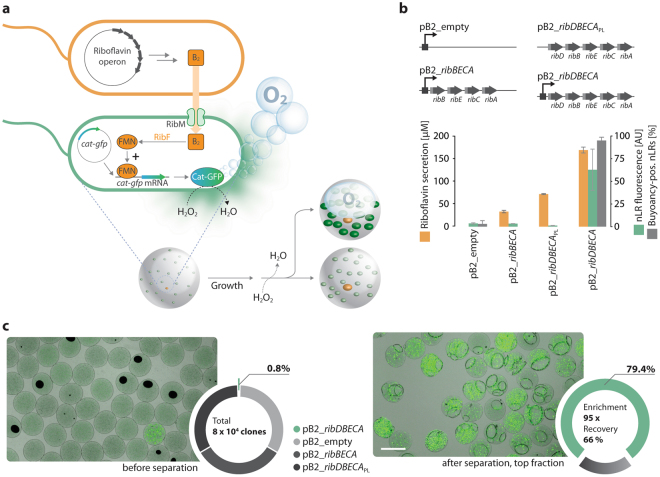
Enrichment of high B2 producing strains by buoyancy separation. (a) Principle of the screen: The nLRs are inoculated with B2 producing (orange) and B2 sensing (green) E. coli cells. The sensing cells take up B2 via RibM and convert it to FMN. FMN then translationally upregulates synthesis of a Cat-GFP fusion protein, thereby providing the basis for two-fold identification of potent B2 secreting isolates. (b) Upper panel: E. coli BW23474 whole cell biocatalysts were equipped with one of four different plasmids leading to different degrees of B2 overproduction in shake flasks (lower panel, orange columns). Next, the biocatalysts were encapsulated in nLRs (on average 0.2 cells per nLR) together with biosensors (on average 1,000 cells per nLR). The nLRs were incubated, subjected to separation on a microscope slide in a water droplet, and the buoyancy-positive nLRs were counted under the microscope and analysed for GFP fluorescence. Only the high B2 producing strain led to a large fraction of ascending nLRs (pB2_ribDBECA: 114 of 120), whereas the others did not (pB2_ribDBECAPL: 0 of 60; pB2_ribBECA: 0 of 57; pB2_empty: 3 of 101). One-way ANOVA indicated a statistically significant difference among the different strains for B2 secretion (F(2,15) = 1312.57, p < 0.00001, α = 0.01) and separation (F(3,14) = 1463.94, p < 0.00001, α = 0.01). Data shown as mean ± SD, n = 4 to 5 with 11 to 25 nLRs per experiment. (c) Approx. 363,000 nLRs were inoculated with approx. 79,000 E. coli cells obtained from four different B2 producing whole cell biocatalysts (see b). The most potent B2 producing whole cell biocatalyst carrying plasmid pB2_ribDBECA was underrepresented (660 cells, 0.8%). An overlay of bright field and epifluorescence microscopic images of the nLR population before (left image, bulk) and after (right picture, top fraction) buoyancy separation indicates efficient enrichment of nLRs with Cat-GFP overexpressing biosensors. These observations were verified by counting the fluorescently labelled high B2-producer containing nLRs within the total population by large-particle flow cytometry (549 nLRs). Scale bar: 500 µm.

