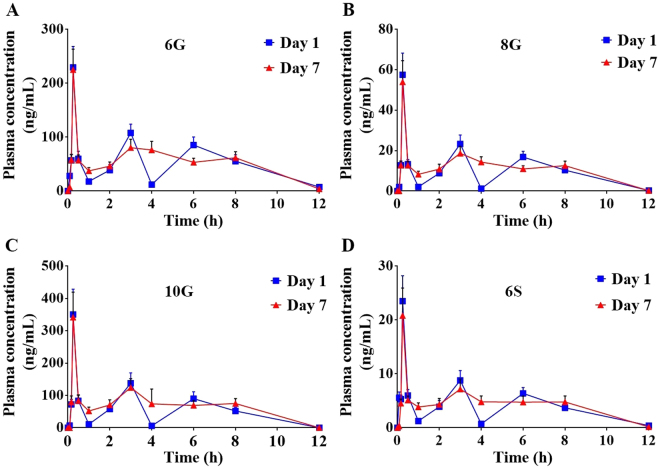
Figure 1.
Comparison of plasma kinetics on day 1 vs. day 7 of Ginger phenolics following daily dose administration of GE at 250 mg/kg. The plasma concentrations of (A) 6G, (B) 8G, (C) 10G and (D) 6S were quantitated in samples collected at various time points (0, 0.08, 0.16, 0.25, 0.5, 1, 2, 3, 4, 6, 8 and 12 h) on day 1 vs day 7 following oral administration of GE. Values and error bars shown in the figure represent mean and standard deviation (SD), respectively.

