
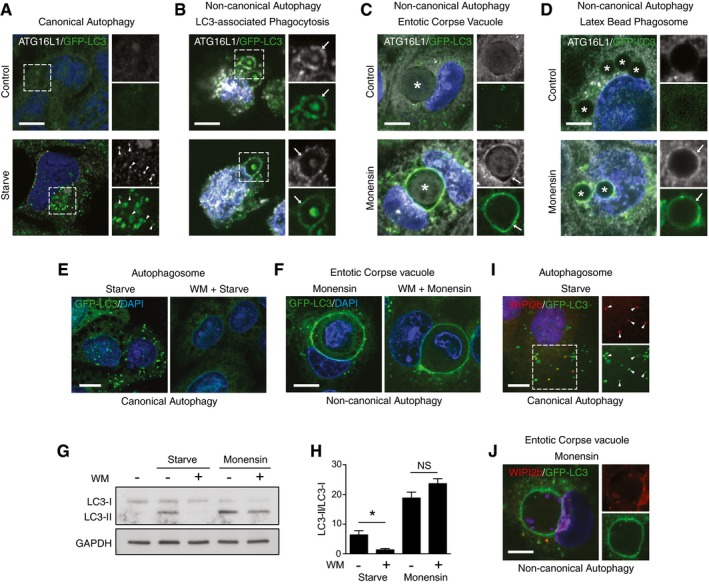
Figure 1. ATG16L1 is recruited to endolysosomal membranes during non‐canonical autophagy.
-
AConfocal images of control and starved HCT116 cells expressing GFP‐LC3 and stained for ATG16L1. Arrows indicate autophagosome puncta double positive for LC3 and ATG16L1. Scale bar: 10 μm.
-
B–DConfocal images of ATG16L1 and GFP‐LC3 on (B) zymosan‐containing phagosomes in J774A.1 cells (arrows indicate phagosomes), scale bar: 5 μm; (C) monensin‐treated entotic corpse vacuoles in MCF10A cells (asterisk indicate entotic corpse, arrows indicate entotic vacuoles), scale bar: 10 μm; and (D) latex bead‐containing phagosomes in monensin‐treated HCT116 cells (asterisk indicate bead‐containing phagosomes, arrows indicate phagosome membranes), scale bar: 5 μm.
-
E, FConfocal images of GFP‐LC3 in (E) starved cells or (F) entotic corpse vacuoles in monensin‐treated MCF10A cells ± wortmannin pretreatment. Scale bars: 10 μm.
-
GWestern blotting of LC3 in control, starved or monensin‐treated HEK293 cells ± wortmannin.
-
HQuantification of LC3‐II/LC3‐I ratios from (G).
-
I, JConfocal images of WIPI2b staining and GFP‐LC3 in (I) starved HCT116 cells. Arrows indicated double‐positive autophagosome structures, and (J) entotic corpse vacuoles in monensin‐treated MCF10A cells. Scale bars: 10 μm.