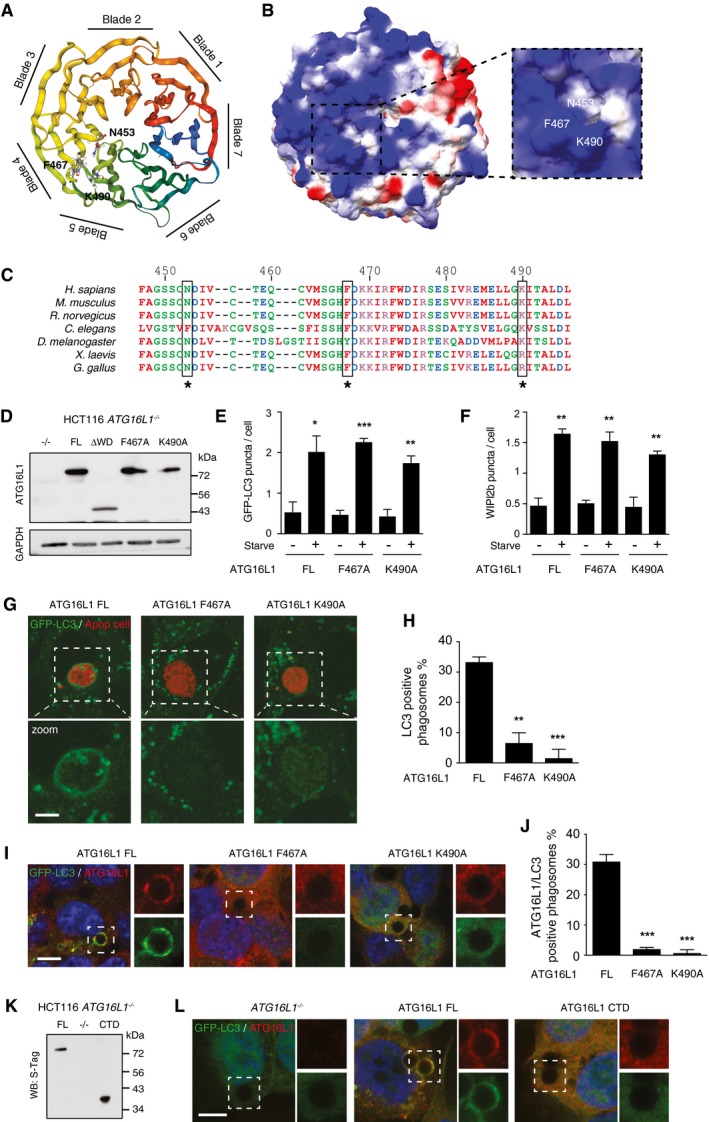
Ribbon model of the top face of ATG16L1 WD40 CTD with critical residues in ball and stick. Structural image generated in NGL viewer using Protein Database (PDB) 5NUV.
Surface of ATG16L1 WD40 CTD coloured to electrostatic potential (blue positive 2, red negative −2). Cropped image a zoom of the critical residues. Image generated in Swiss‐PdbViewer.
Annotated alignment of ATG16L1 sequences (447–496) over different species.
Western blot analysis of ATG16L1 in HCT116 ATG16L1
−/− cells stably re‐expressing ATG16L1 constructs.
Quantification of GFP‐LC3 puncta from 100 HCT116 cells per experiment cultured in full media (control) or EBSS (starve) for 1 h.
Quantification of WIPI2b puncta from 100 HCT116 cells per experiment cultured in full media (control) or EBSS (starve) for 1 h.
Confocal images of GFP‐LC3 in ATG16L1‐complemented MEF cells phagocytosing red‐labelled apoptotic cells. Scale bar: 5 μm.
Quantification of GFP‐LC3 recruitment to apoptotic corpse‐containing phagosomes in (G). Twenty phagosomes were counted per experiment.
Confocal images of GFP‐LC3 and ATG16L1 on latex bead‐containing phagosomes in FL, F467A‐ and K490A‐expressing HCT116 cells ± monensin (100 μM, 1 h). Cropped images show phagosomes. Scale bar: 5 μm.
Quantification of ATG16L1/GFP‐LC3‐positive phagosomes from (I).
Western blot analysis of ATG16L1 in HCT116 ATG16L1
−/− cells stably re‐expressing full‐length (FL) and CTD (336‐623) ATG16L1 constructs.
Confocal images of GFP‐LC3 and ATG16L1 stained with anti‐S‐Tag antibodies on latex bead‐containing phagosomes in knockout, FL and CTD expressing HCT116 cells ± monensin (100 μM, 1 h). Cropped images show phagosomes. Scale bar: 5 μm
Data information: In (E, F, H, J), data are presented as mean ± SEM from three separate experiments. (E) *
< 0.0001. (F) **
< 0.005. (H) **
< 0.0002. (J) ***
‐test).