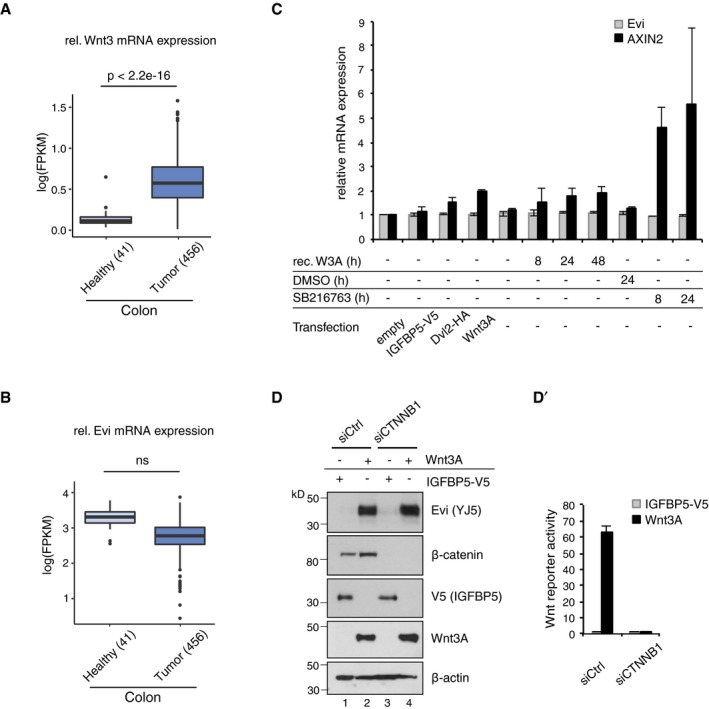
Figure EV1. Evi is not transcriptionally regulated by Wnt.

-
A, BFPKM‐normalized RNA‐seq. data of the TCGA Research Network (TCGA‐COAD; http://cancergenome.nih.gov/; 09/25/2017) were log‐transformed to illustrate the relative expression of (A) Wnt3 and (B) Evi in healthy colon (41) versus colon adenocarcinoma (456). The distribution into tumor and healthy samples was based on their barcodes as described in TCGA Wiki. Statistical significance of gene expression differences was determined using a Student's t‐test under the alternative hypothesis H1 that gene expression is higher in tumors compared to healthy tissue. The boxplot diagram shows the median as line within the box, the 25th and 75th percentiles as the upper and lower part of the box, the 10th and 90th percentiles as error bars and outliers as circles.
-
CHEK293T cells were transfected with the indicated expression constructs, treated with 100 ng/ml recombinant mouse Wnt3A (rec. W3A) or with 10 μM GSK3 inhibitor SB216763 for the indicated hours (h). AXIN2 and Evi mRNA levels were analyzed by qRT–PCR and normalized to GAPDH expression. Results are shown as mean ± s.d. from three independent experiments.
-
D, D′Twenty‐four hours after reverse transfection with Ctrl or CTNNB1 siRNA, HEK293T cells were transfected with Wnt3A or IGFBP5‐V5 expression plasmids and analyzed (D) for the indicated proteins via immunoblotting or (D′) for canonical Wnt activity using the TCF‐Luciferase Wnt reporter assay. Immunoblotting is representative of three independent experiments, and Wnt reporter activity was calculated as mean from three independent experiments ± s.d.
Source data are available online for this figure.
