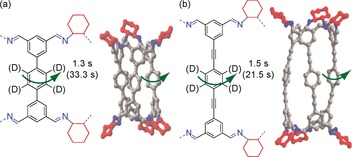
Figure 1.

Chemical structure and side view of the X‐ray crystal structure of (a) TCC2‐R and (b) TCC3‐R.10 The cyclohexane groups are shown in red; other C, grey; N, blue; H omitted for clarity in the crystal structure representation. The green arrows indicate fast molecular rotation of the para‐phenylene. The 13C spin‐lattice relaxation times (T1) obtained for selected carbons are given in the Figure, including T1 values after iodine loading (values in parentheses). The deuterium‐labelled positions on the para‐phenylene are also shown for [D12]TCC2‐R and [D12]TCC3‐R.
