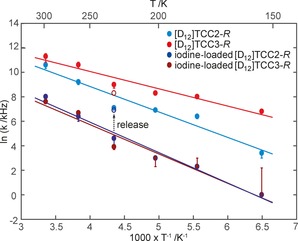
Figure 3.

Arrhenius plot of the rotational rates, k, of the para‐phenylene ring in desolvated and iodine‐loaded [D12]TCC2‐R and [D12]TCC3‐R molecular rotor cages. The lines show the linear fit to the Arrhenius equation with the extracted values being reported in Table 1. Error bars are estimated from comparison of the 2H NMR line shape fit at various rotational rates. The errors associated with the 154 K rates for iodine‐loaded [D12]TCC2‐R and [D12]TCC3‐R are due to the indistinguishable line shape between 1 and 9 kHz. The 2H NMR rotational rates obtained at 230 K from the iodine released [D12]TCC2‐R and [D12]TCC3‐R cages are also shown in empty circles.
