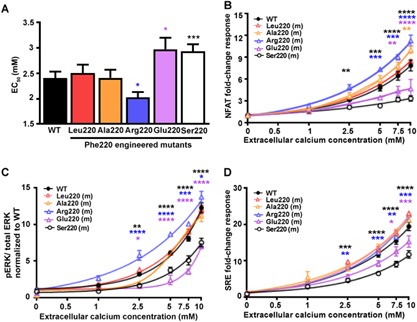
Figure 3.

Effect of Gα11 residue 220 hydrophobicity on PLC‐mediated signaling. (A) Histograms showing Ca2+ e‐induced Ca2+ i EC50 values with 95% confidence intervals (CIs) for cells expressing WT Phe220 or residue 220 mutant (m) Gα11 proteins from 6 to 12 transfections. Statistical analyses were performed using the F‐test. The Arg220 Gα11 mutant reduced the EC50 value, whereas the Glu220 and Ser220 Gα11 mutants elevated the EC50 value. (B) Ca2+ e‐induced NFAT reporter responses, which assess Ca2+ i signaling, of cells expressing WT or residue 220 mutant Gα11 proteins. Responses at each [Ca2+]e are expressed as a fold‐change of basal [Ca2+]e responses, and shown as mean ± SE of 4 to 12 transfections. NFAT luciferase reporter activity increased in all cells in a concentration‐dependent manner, however responses were significantly elevated in Arg220 Gα11 mutant, and reduced in Glu220 Gα11 mutant cells, compared to WT cells. (C) Ca2+ e‐induced pERK responses of cells expressing WT or mutant residue 220 Gα11 proteins, expressed as a ratio to total ERK levels. The Arg220 mutant was associated with significantly increased responses, and the Glu220 and Ser220 mutants were associated with decreased responses, when compared to WT. Data are shown as mean ± SE of 4 to 8 independent transfections. (D) Ca2+ e‐induced SRE reporter responses of cells expressing WT or mutant (m) residue 220 Gα11 proteins, expressed compared to basal SRE reporter activity. The engineered Arg220 mutant was associated with significantly increased, and the engineered Glu220 and FHH2‐associated Ser220 mutants resulted in decreased responses, when compared to WT. Data are shown as mean ± SE of 4 to 8 independent transfections. Statistical analyses performed using 2‐way ANOVA with Tukey's multiple‐comparisons test comparing WT with Gα11 mutants Ala220, Arg220, Glu220, and Ser220. *p < 0.05, **p < 0.01, ***p < 0.001, ****p < 0.0001.
