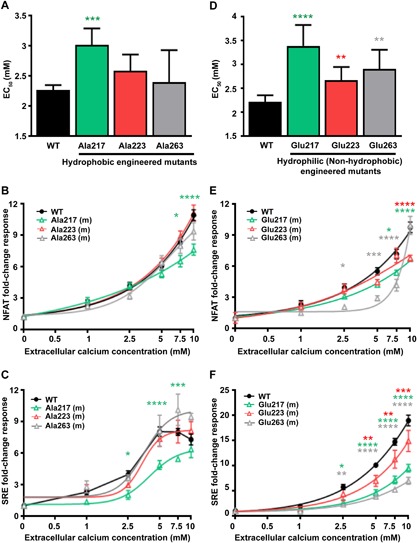
Figure 4.

Effect of mutating residues within the Gα11 switch II‐α3 hydrophobic cluster on PLC‐mediated signaling. (A) Histograms showing Ca2+ e‐induced Ca2+ i EC50 values with 95% CI for cells expressing WT and alanine (Ala) Gα11 mutants (m) of residues 217, 223, and 263 Gα11 proteins from 4 to 8 independent transfections. Only the Ala217 Gα11 mutant increased the EC50 value, when compared to WT cells. Statistical analyses were performed using the F‐test. (B, C) Ca2+ e‐induced (B) NFAT and (C) SRE luciferase reporter responses of cells expressing WT or alanine (Ala) Gα11 mutants. Responses at each [Ca2+]e are expressed as a fold‐change of basal [Ca2+]e responses, and shown as mean ± SE of 4 to 8 transfections. NFAT and SRE reporter responses were significantly reduced in Ala217‐expressing cells compared to WT cells. (D) Histograms showing Ca2+ e‐induced Ca2+ i EC50 values with 95% CI for cells expressing WT and glutamic acid (Glu) Gα11 mutants (m) of residues 217, 223, and 263 from 4 to 8 independent transfections. All Glu Gα11 mutants increased the EC50 value, when compared to WT cells. Statistical analyses were performed using the F‐test. (E, F) Ca2+ e‐induced (E) NFAT and (F) SRE luciferase reporter responses of cells expressing WT or glutamic acid (Glu) Gα11 mutants. Responses at each [Ca2+]e are expressed as a fold‐change of basal [Ca2+]e responses, and shown as mean ± SE of 4 to 8 transfections. NFAT and SRE reporter responses were significantly reduced in cells expressing all 3 glutamic acid mutants compared to WT cells. Statistical analyses for B, C, E, and F were performed using 2‐way ANOVA with Tukey's multiple‐comparisons test comparing WT to mutant 217 (green), 223 (red), and 263 (gray) Gα11 proteins. *p < 0.05, ***p < 0.001, ****p < 0.0001.
