
Figure 3.
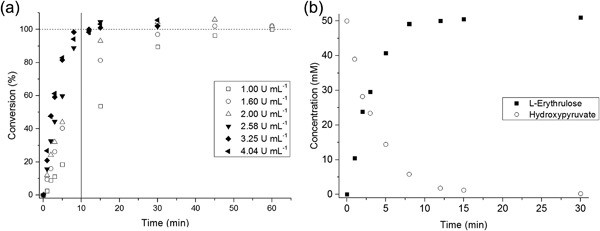
(a) Transketolase reaction profile for the production of L‐erythrulose (ERY) at various enzyme activities. A total of 100% conversion corresponded to the production of 50 mM of ERY (dashed line). (b) Transketolase reaction profile at 3.25 U ml−1 (i.e., 0.77 U per reactor volume) showing the production of ERY and consumption of hydroxypyruvate (HPA). All reactions were performed at 20°C with initial concentrations of HPA and glycolaldehyde (GA) of 50 mM. Experiments were performed in duplicate (n = 2) with one standard error below 5%