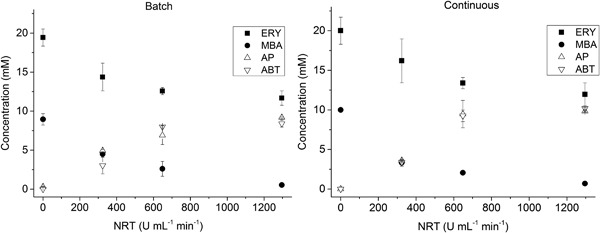
Figure 6.

Reaction profiles for the coupled transketolase‐transaminase reaction a sequentially added batch (left) and in a microfluidic reaction cascade (right) for residence times up to 2 hr. The reactions were performed at 20°C with an initial concentration of 50 mM of GA and HPA for the TK reaction, and with an initial substrate concentrations in flow of 20 mM L‐erythrulose (ERY), 10 mM (S)‐α‐methylbenzylamine (MBA) with transketolase and transaminase enzyme activity of 3.25 U ml−1 and 10.8 U ml−1, respectively. The TK reaction was performed at a starting pH of pH 7, while the TAm reaction was performed at pH 9. The TK reaction was not the rate‐limiting step in the cascade system and therefore neglected. Reactions were performed in triplicates (n = 3), error bars representing one standard deviation. To compare batch and continuous reactions the residence times were normalized according to Marques et al. (2012).
