
Figure 2.
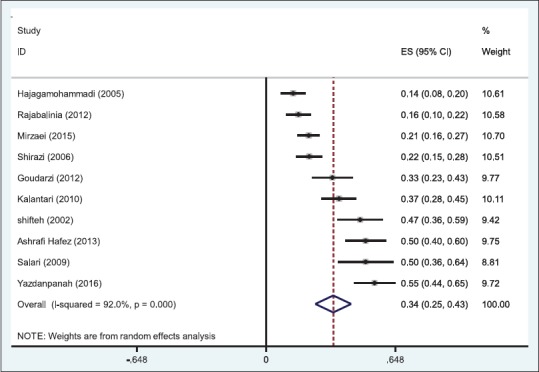
Prevalence of peptic ulcer with 95% confidence interval in the studies. Each line shows 95% confidence interval; diamond shows overall effects of studies. Overall prevalence of partial and total peptic ulcer using the random effects model. Each square represents the effect estimates for each individual study. Their confidence interval for peptic ulcer prevalence is reflected by the size of each square proportional to the weight assigned to each study within the meta-analysis. The diamond represents the overall pooled results