
Figure 6.
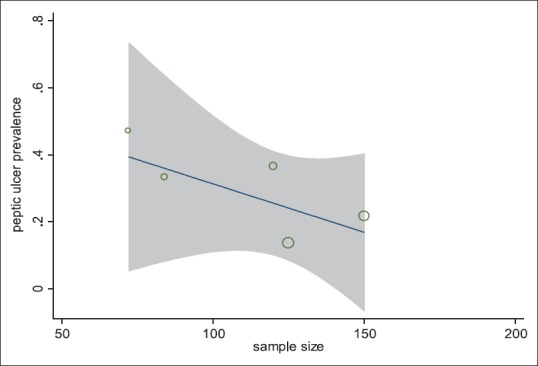
Meta-regression according to the sample size. Presentation of the relationship between sample size and peptic ulcer prevalence. Each circle represents the sample size, and as the volume of each circle increases, the sample size is increased