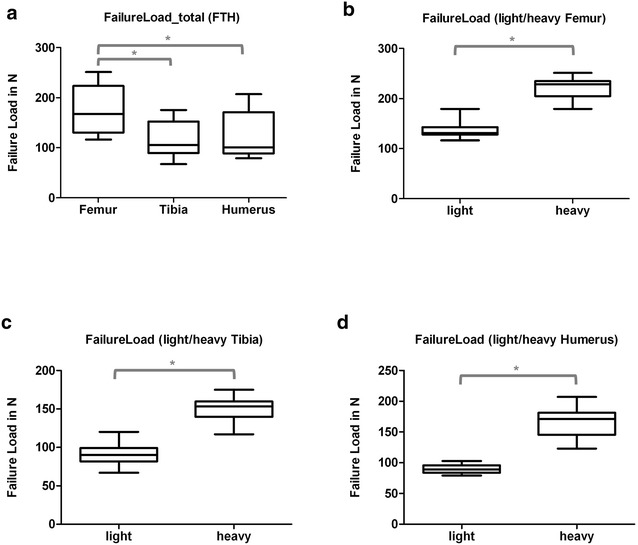
Fig. 3.

Box plots, failure loads (N) for al tested bones (a) and for each bone-type separated into specimens of light (< 400 g) and heavy (< 400 g) animals (b–d). * Indicates significant difference. a Summary (Group comparisons by One-way ANOVA, Tukey’s test). b Femur (Group comparisons by t test). c Tibia (Group comparisons by t test). d Humerus (Group comparisons by t test)
