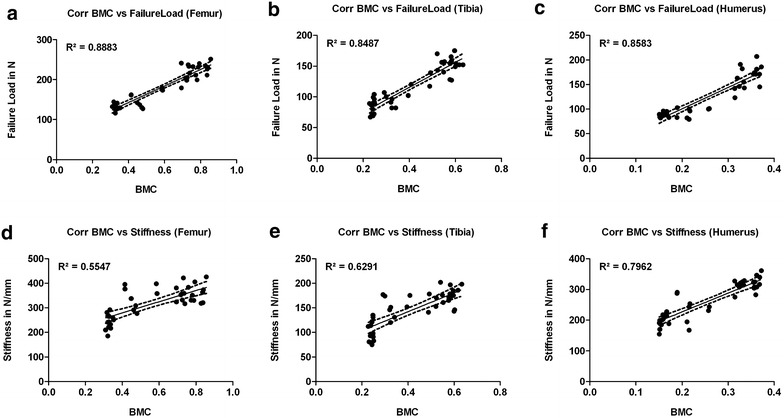
Fig. 5.

Correlation graphs (Bivariate Scattergrams with regression lines and 95% confidence bands). First line: correlation of the BMC with failure loads for femurs (a), tibiae (b) and humeri (c). In general, strong correlations of the BMC with failure loads could be observed. Second line: correlation of the BMC with stiffness for femurs (d), tibiae (e) and humeri (f). Here, only moderate correlations could be shown, except for the humerus (f)
