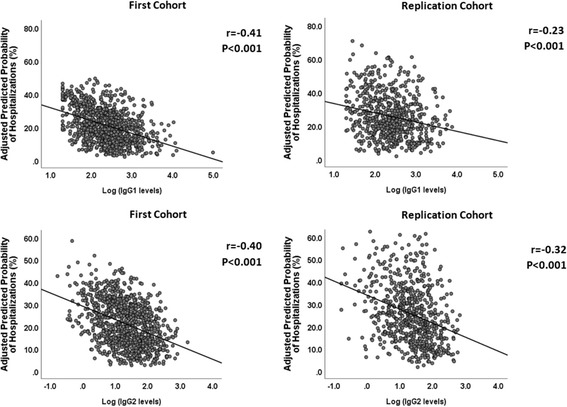
Fig. 3.

Correlation of IgG1 (upper panel) and IgG2 (lower panel) levels (log-transformed, base2) and the predicted risk of hospitalizations. For each participant, the predicted risks were calculated using logistic regression models with adjustments for the following covariates: study drug (azithromycin vs. placebo in MACRO - First cohort; simvastatin vs. placebo in STATCOPE - Replication cohort), age, gender, ethnicity (Caucasian vs. non-Caucasian), FEV1 (% of predicted values), smoking status (current vs. former smokers), oxygen dependence, inhaled corticosteroid use, and treatment with systemic steroids in previous year
