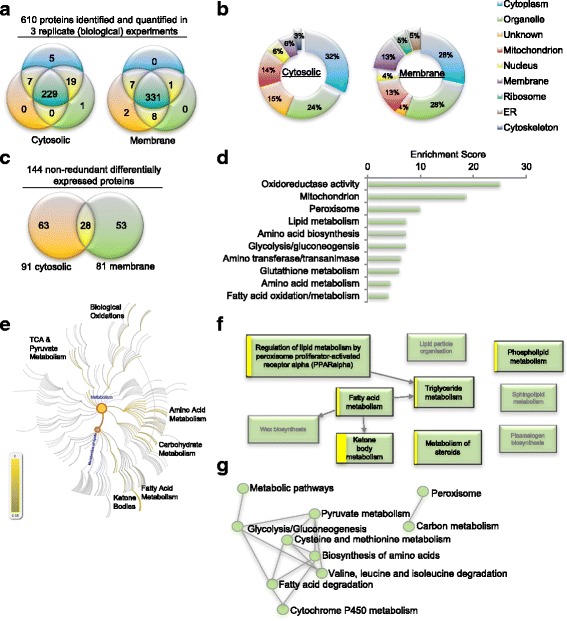
Fig. 1.

iTRAQ-based proteomic analysis of murine liver membrane and cytosolic proteins.
a Venn analysis of proteins stringently identified and quantified by Scaffold_4.8.4 Q+, across biological replicates. Minimum thresholds for protein identification were set at 99% probability and at least 2 unique identified peptides. Protein probabilities were assigned by the Protein Prophet algorithm [57] and the calculated FDR for protein identification was < 0.05%. b Annotation of Gene Ontology (GO) category ‘cellular component ‘. c 91 cytosolic and 82 membranous proteins were identified significantly (P < 0.05) differentially expressed in all biological replicates, based on both randomized permutation and Kruskal-Wallis tests with Benjamini-Hochberg FDR for multiple testing corrections. 28 proteins were found in extracts from both cellular compartments. d Top functional annotation clusters, derived from multiple public sources of protein and gene annotation (eg GO, Uniprot, KEGG) utilizing the DAVID [23] knowledgebase, identified significantly enriched among the differentially expressed proteins. e Pathway topological analysis of the Reactome knowledgebase [25] illustrating pathway overrepresentation as corrected probability; intensity of scale indicates FDR. The lipid metabolism node is highlighted (in orange with blue writing) branching from overall metabolism node. f Dysregulated pathways branching from the lipid metabolism node. Box size is proportional to the entities in the Reactome pathway; the yellow band is proportional to the number of differentially expressed proteins that match against the query dataset; pathways over-represented are bolded with black text, shaded boxes represent pathways not found enriched. g Connectivity of enriched KEGG knowledgebase [27] pathways identified by Enrichr [26] analysis.
